 WebVerified
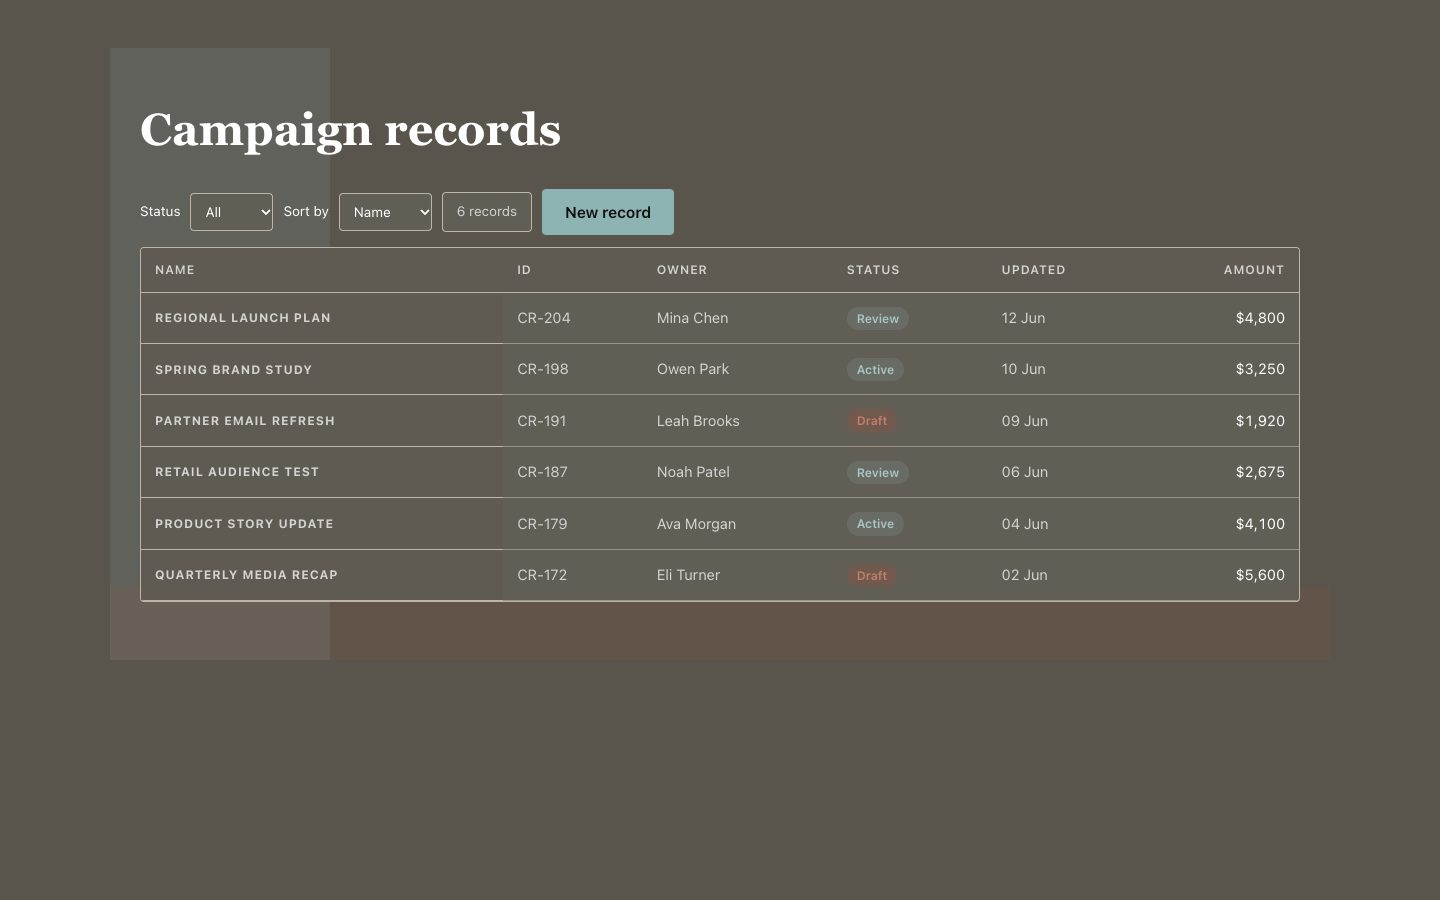
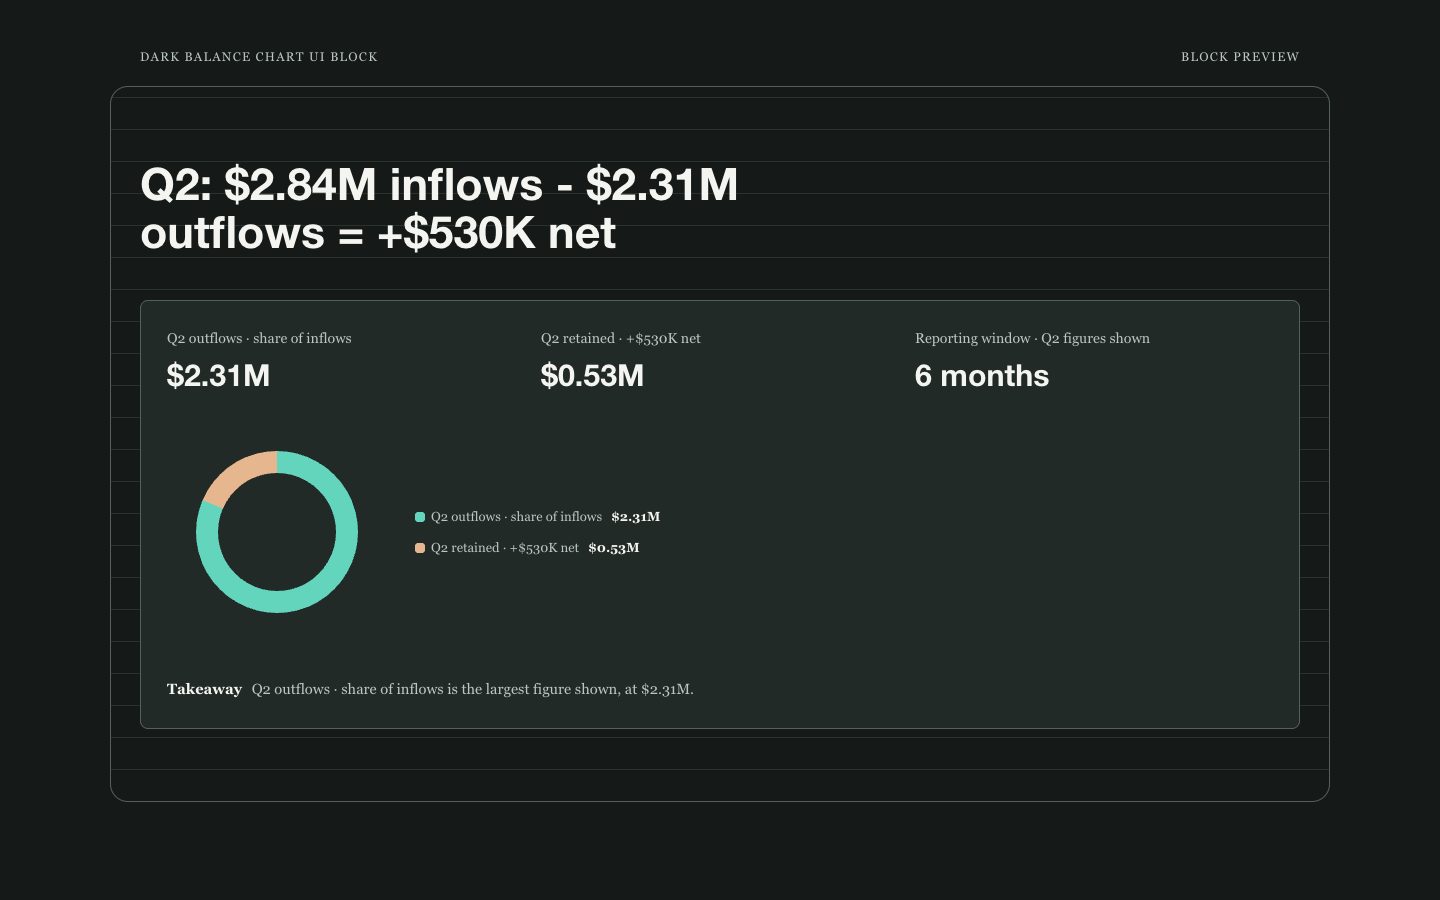
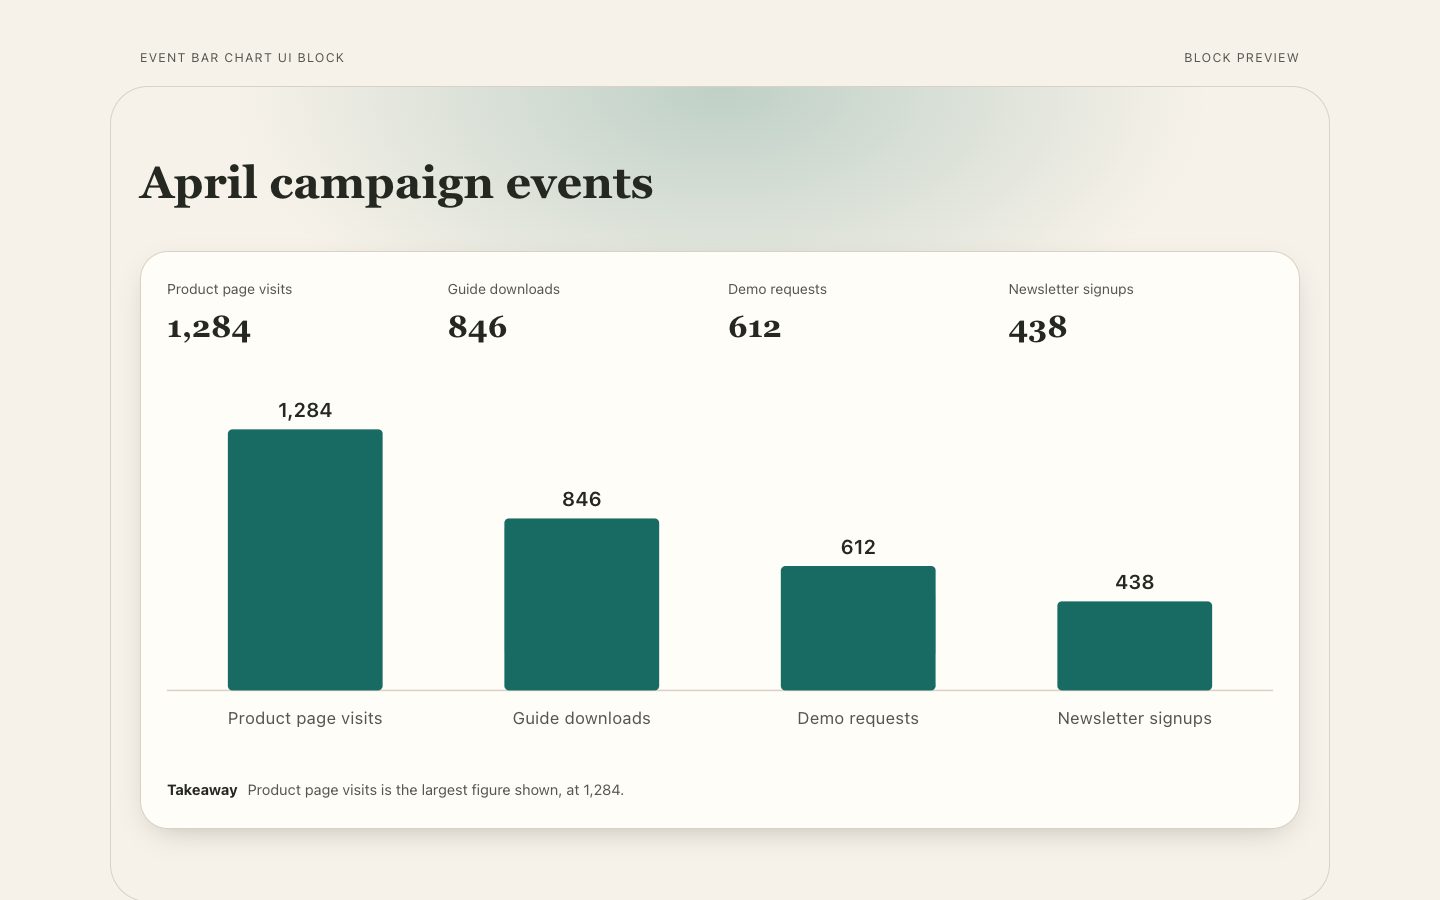
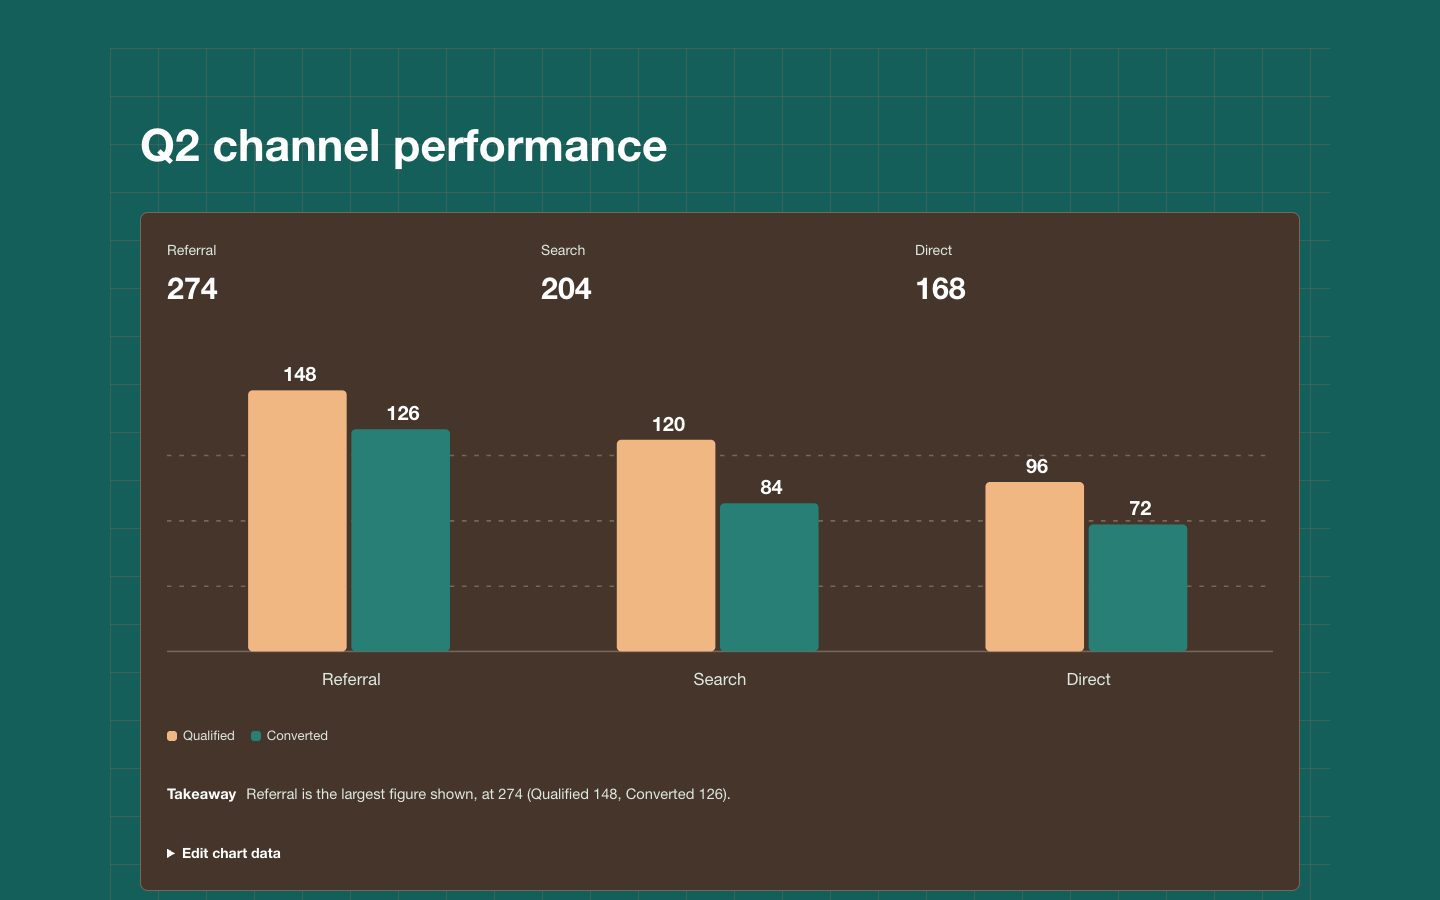
Records Data Grid UI Block
Works with: Claude Code, Cursor, OpenCode, Codex, Gemini CLI


All premium skills for $9.99/month. Cancel anytime.
Upgrade nowUse it to build a web page.
npx skillloom-cli install sl-spreadsheet-data-grid-ui-block
Updated Oct 5, 2026

 WebVerified
 WebVerified
 WebVerified
 WebVerified
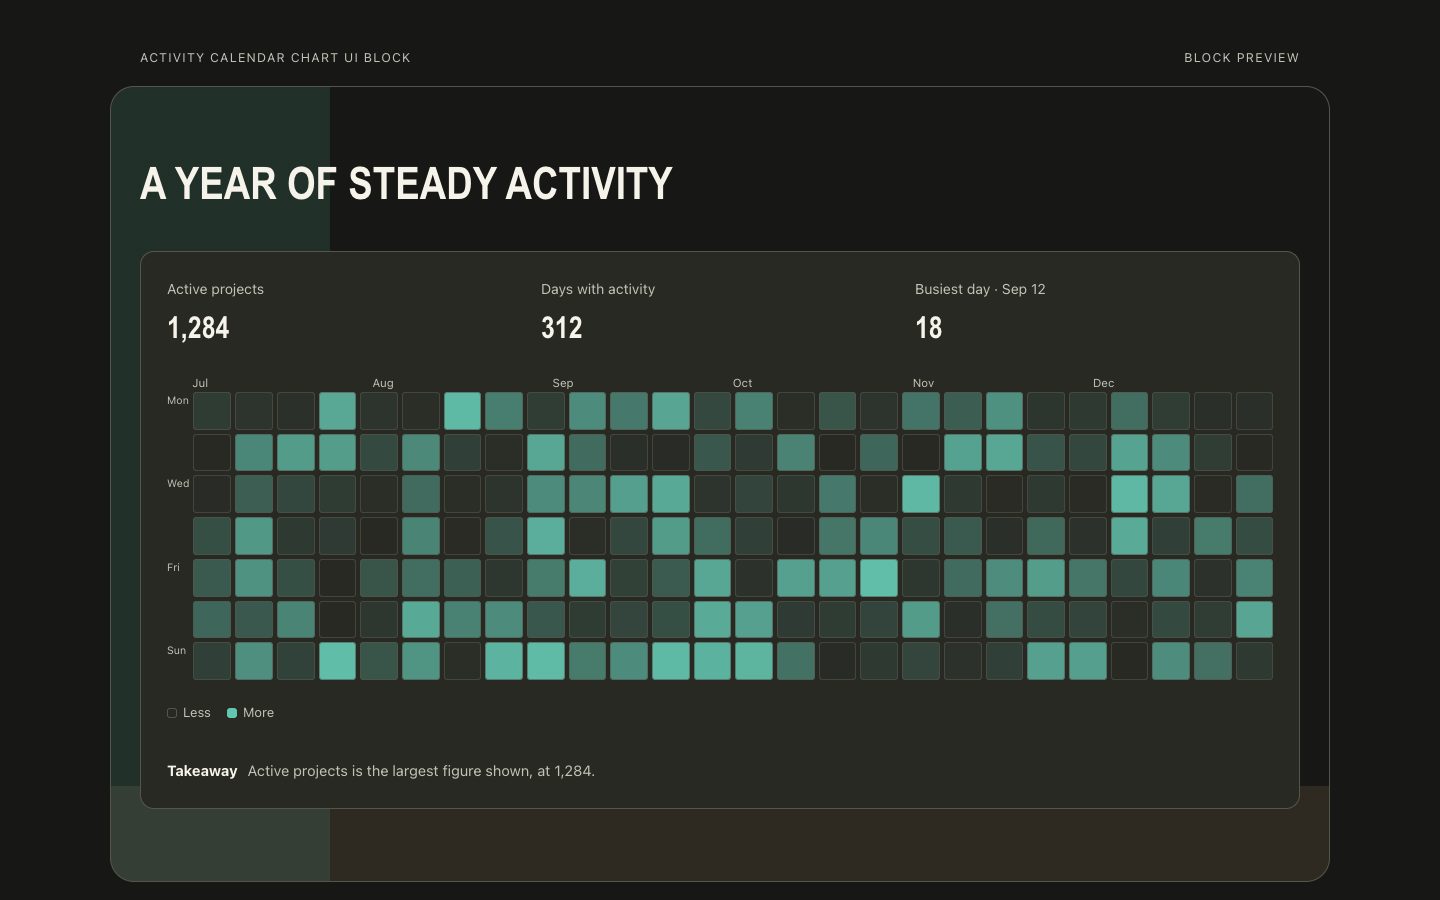 FreeWebVerified
 WebVerified
 WebVerified
 WebVerified
You say
/sl-spreadsheet-data-grid-ui-block Create a one-section Research Spend showcase for product reviewers, with six projects showing each project’s ID, owner, status, update date, and cost. Use the heading “Research Spend” and the warm Index style.
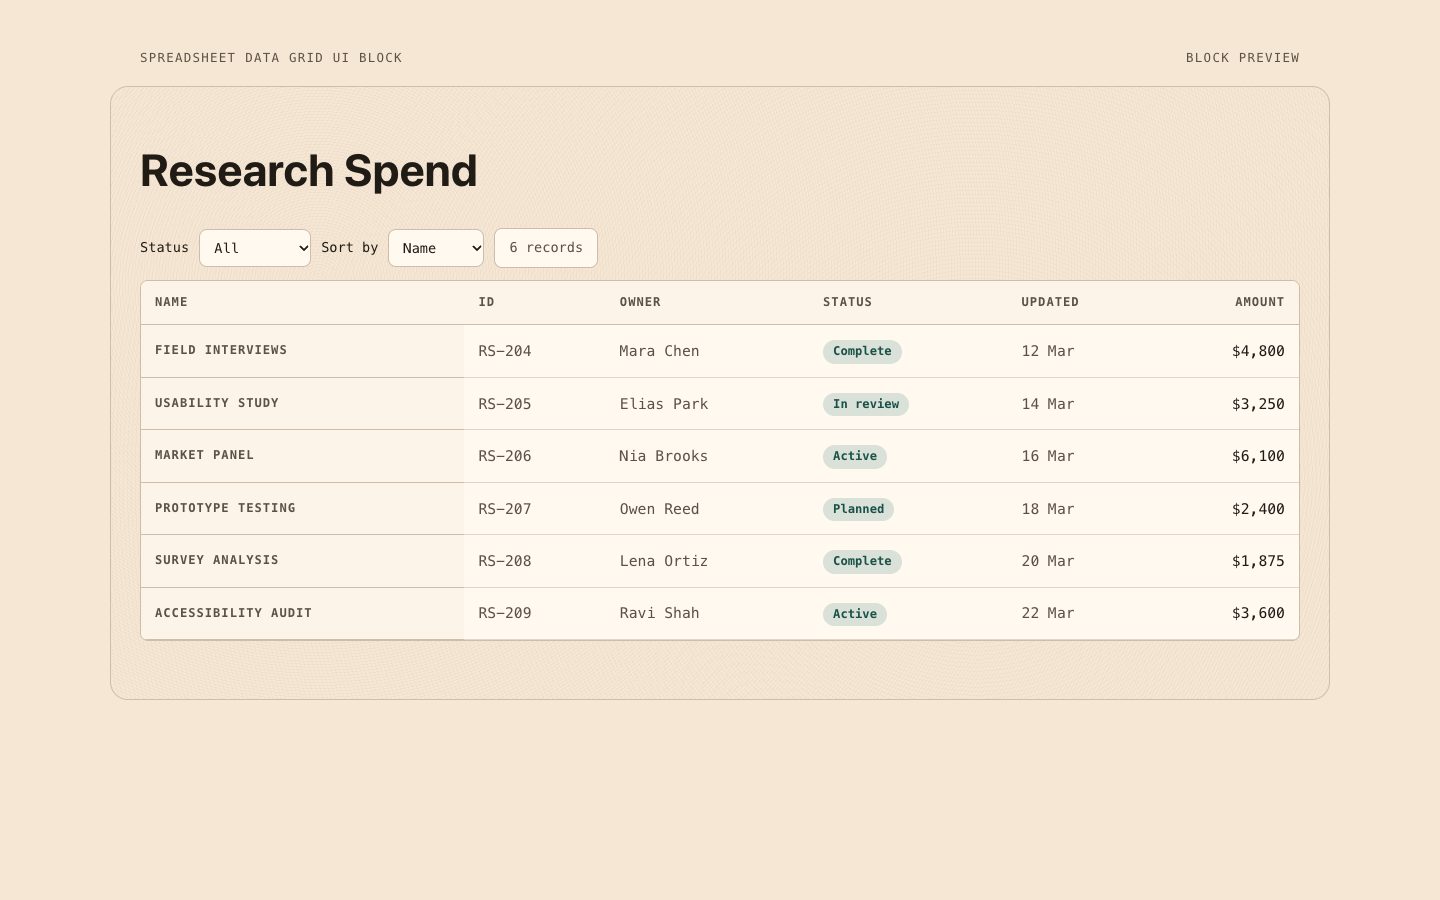
Add a compact empty state and a working reset-filters action.
Adapt the columns for a client campaign performance report.
No external services. Runs entirely on your agent.
4.0/ 5
Render score
Verified
| Real render check | Verified | 4.0 / 5 | 22s |
|---|
Yes. Replace the fictional records and labels with your data while preserving consistent value types and clear column alignment.
No. It creates one reusable page section. Formula editing, workbook navigation, and advanced cell interactions are outside its scope.