WebVerifiedDark Balance Chart UI Block
v1.0.12Use it to build a web page.
npx skillloom-cli install sl-dark-balance-chart-ui-block
Updated Oct 5, 2026
- Install guides
- Claude CodeCodex
- Generates with
- Host Agent LLM
- In the package
6 files · 19.0 KB
- SKILL.md
- references/framework-adaptation.md
- references/section-library.md
- references/style-guide.md
- references/template.html
- scripts/validate-html.mjs
Similar skills
WebVerified
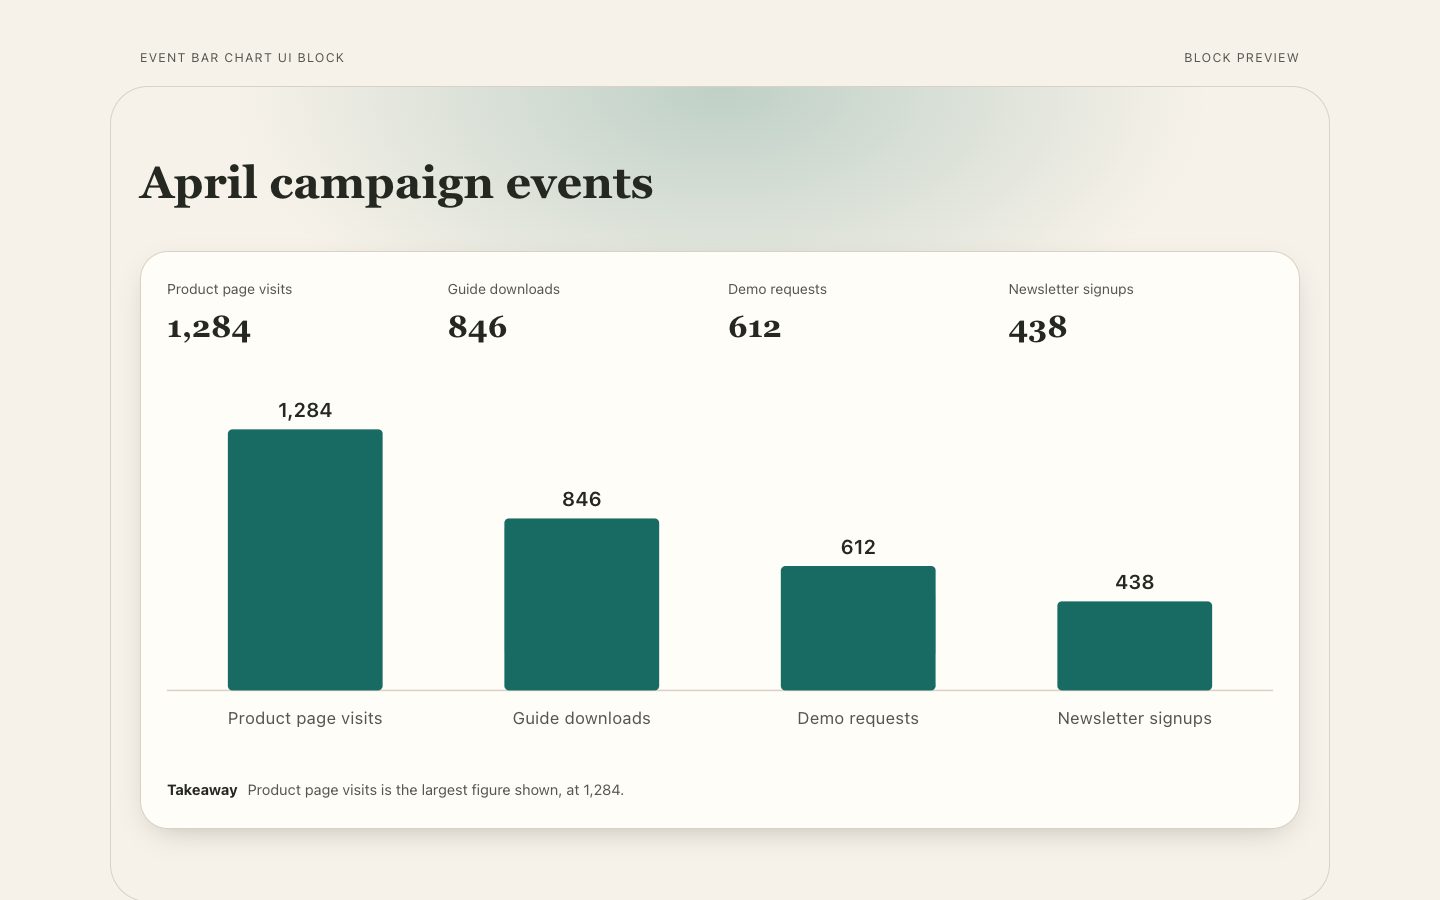
WebVerifiedEvent Bar Chart UI Block
Works with: Claude Code, Cursor, OpenCode, Codex, Gemini CLI
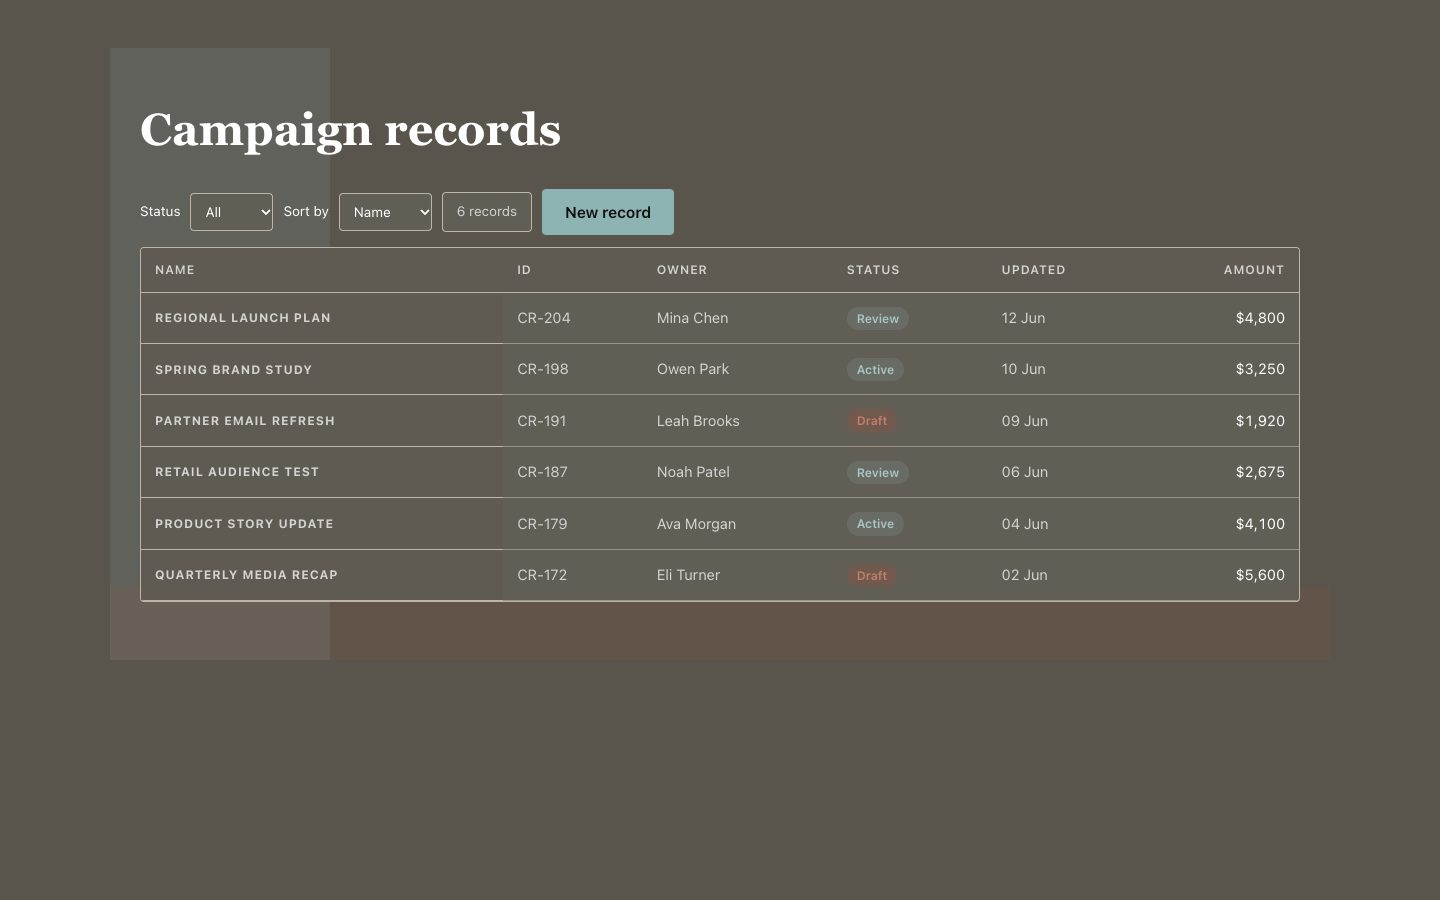
WebVerifiedRecords Data Grid UI Block
Works with: Claude Code, Cursor, OpenCode, Codex, Gemini CLI
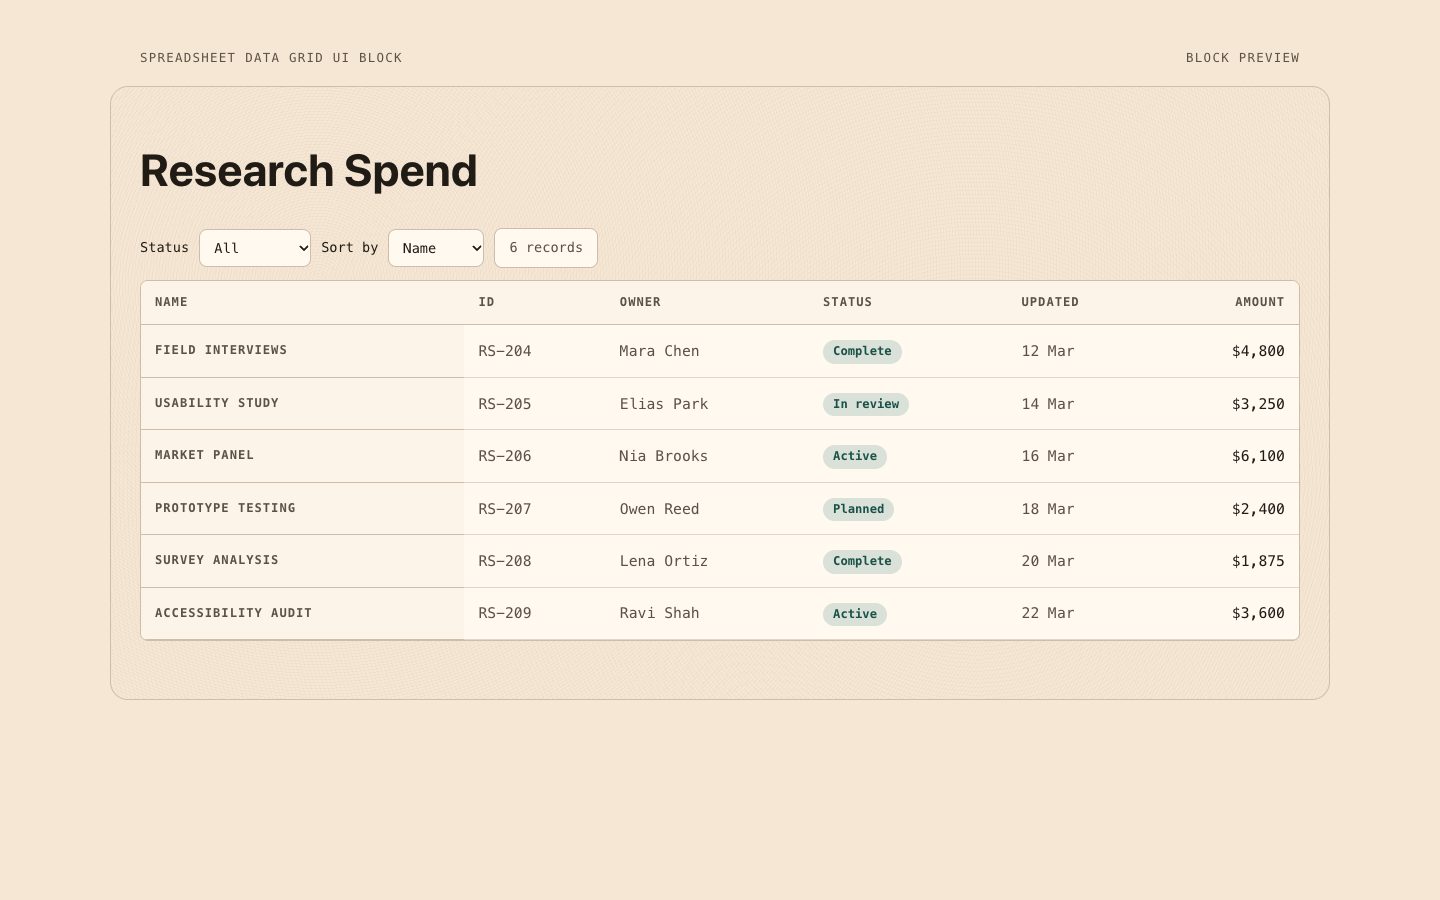
WebVerifiedSpreadsheet Data Grid UI Block
Works with: Claude Code, Cursor, OpenCode, Codex, Gemini CLI
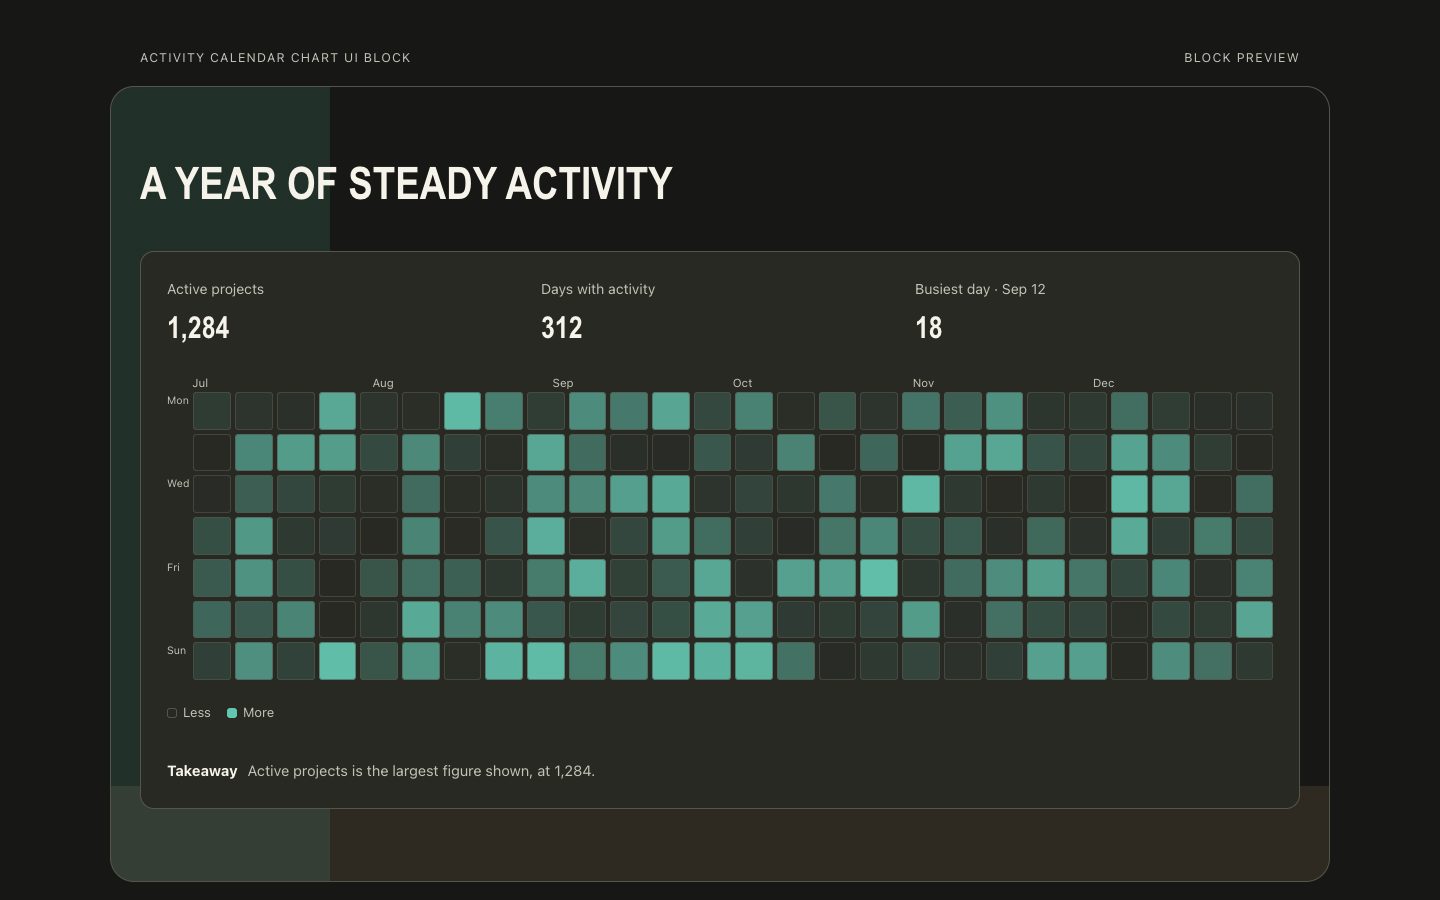
FreeWebVerifiedActivity Calendar Chart UI Block
Works with: Claude Code, Cursor, OpenCode, Codex, Gemini CLI
WebVerifiedParticle Field Hero UI Block
Works with: Claude Code, Cursor, OpenCode, Codex, Gemini CLI
WebVerifiedStrip Hero UI Block
Works with: Claude Code, Cursor, OpenCode, Codex, Gemini CLI
WebVerifiedIntegration Grid Hero UI Block
Works with: Claude Code, Cursor, OpenCode, Codex, Gemini CLIWhat you get
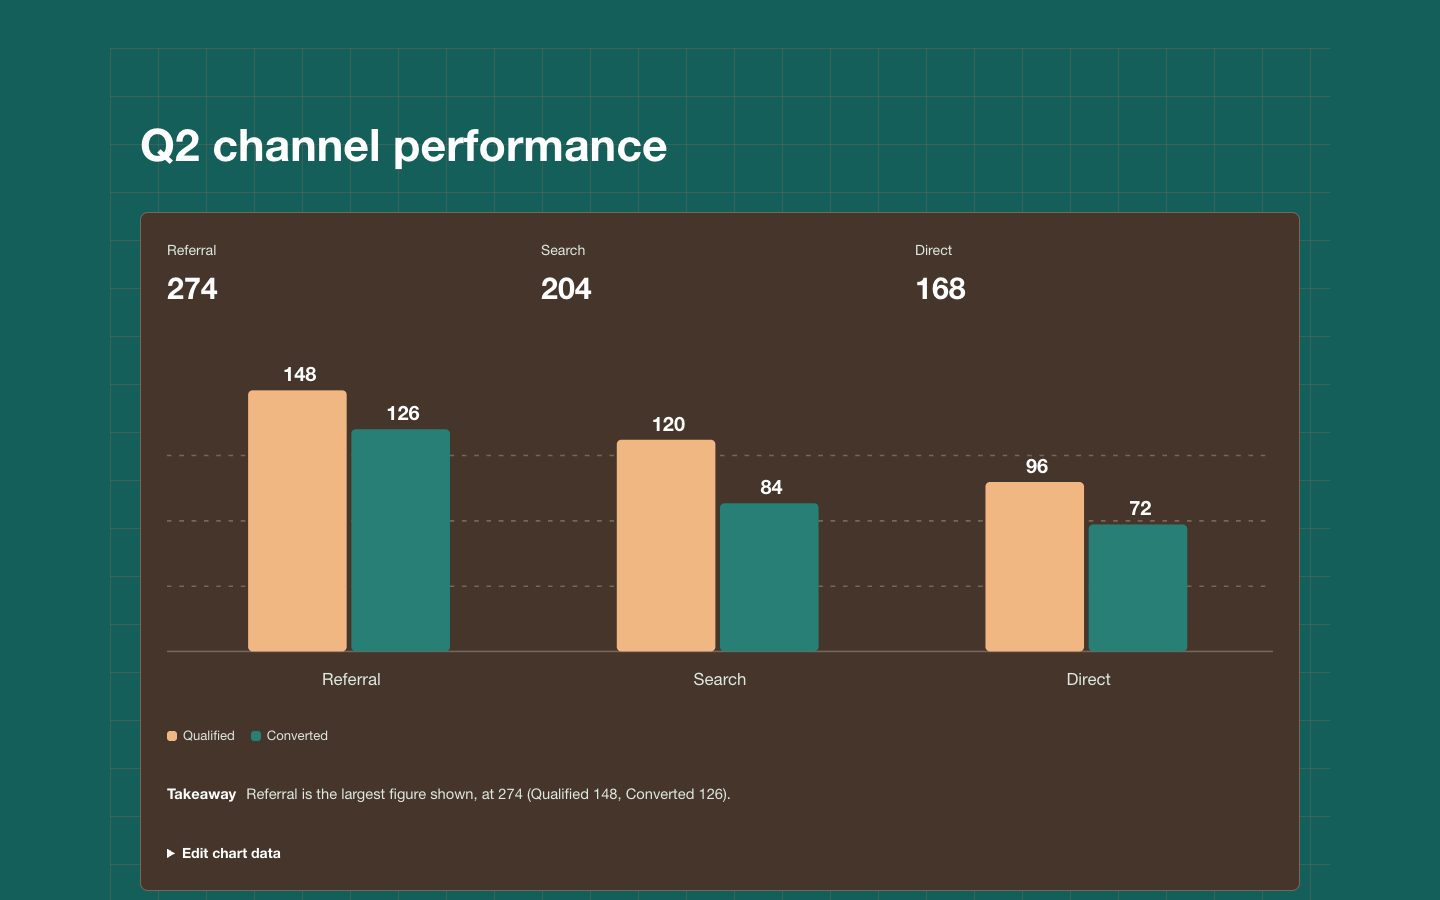
- One responsive dark chart section with clear reporting context.
- A labelled comparison whose values reconcile to the net balance.
- Editable series labels, values, units, and takeaway.
- Accessible text that explains the result without relying on color.
Good fit
- Executive reporting on operating inflows, outflows, and retained balance.
- Research and product pages that need a readable financial comparison.
Not for
- Multi-view analytics products that need dashboard navigation and controls.
- Time-series claims based on aggregate totals alone.
Try this prompt
You say
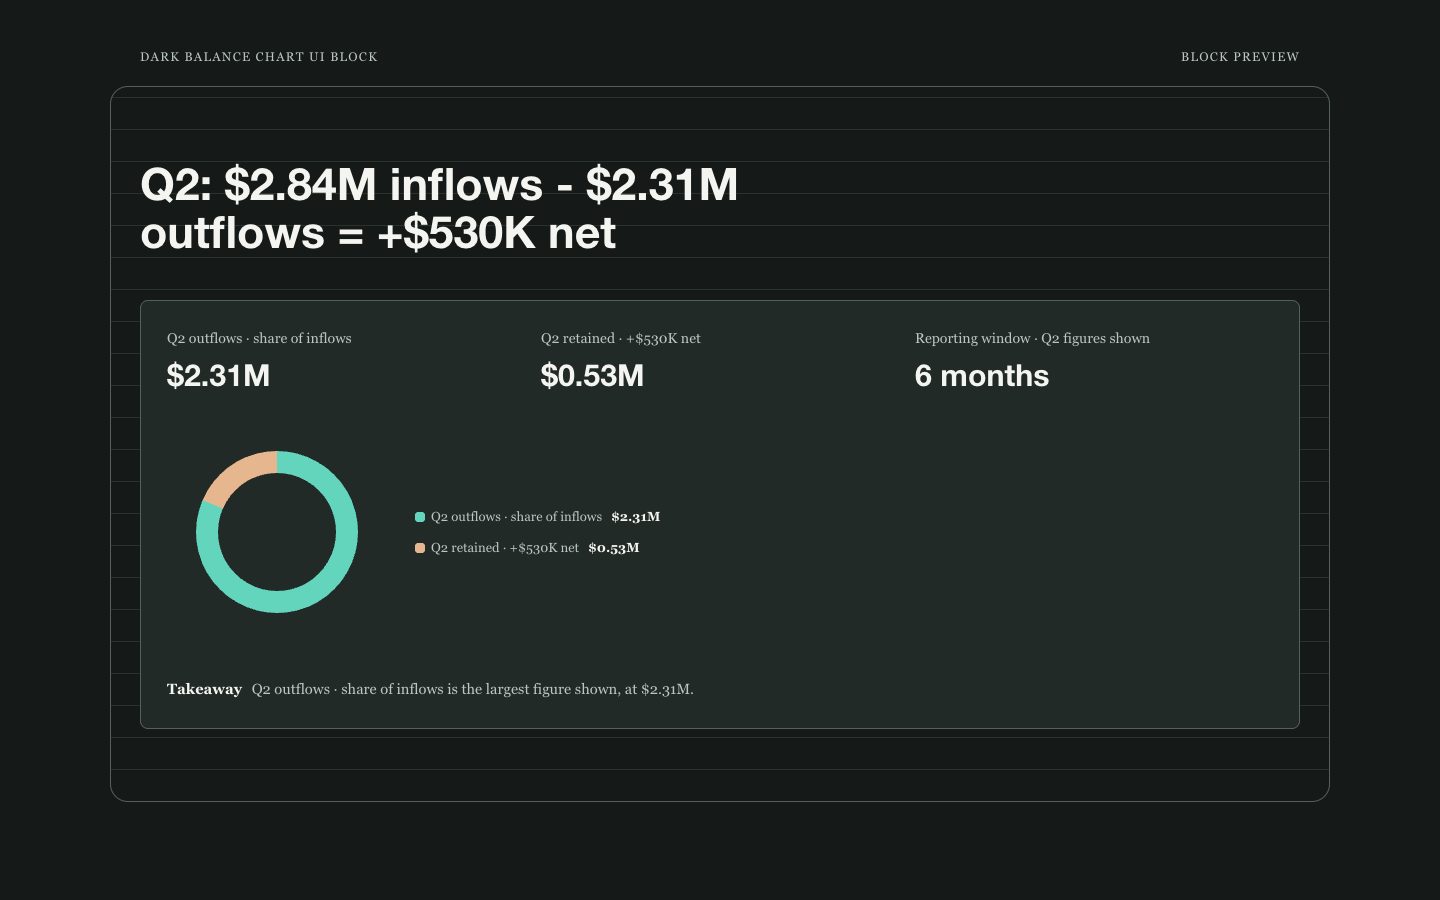
/sl-dark-balance-chart-ui-block Create one dark executive-report stats section for an executive audience: a six-month reporting window showing the Q2 operating balance. Use the headline “Q2: $2.84M inflows - $2.31M outflows = +$530K net” and three stats: “$2.31M” / “Q2 outflows · share of inflows”, “$0.53M” / “Q2 retained · +$530K net”, and “6 months” / “Reporting window · Q2 figures shown”. Use Warm Tidal Balance styling.
Then try
Add a compact accessible data table below the chart without changing the visual hierarchy.
Adapt the chart for a mobile report while keeping the amounts and takeaway readable.
Replace the sample comparison with target versus actual and label the variance clearly.
What you provide
- Inflows and outflows in the same currency and units.
- Reporting period and any time-series values needed to show change over time.
Requirements
- A modern browser
- Node.js 20+ for the validator
Running cost
No external services. Runs entirely on your agent.
Verification
4.0/ 5
Render score
Verified
| Real render check | Verified | 4.0 / 5 | 43s |
|---|
FAQ
Does dark mean the whole section should be dark?
Yes. Use a dark page background and dark chart panel with legible light text; teal and clay distinguish the data.
Can the chart use different data?
Yes. Keep units, reporting period, and calculation explicit, and verify that inflows minus outflows equals the stated net.
Can a donut show the balance changing over six months?
No. A donut can show how an aggregate inflow total divides between outflows and retained balance. Use dated values and a zero-centered time chart to show change over time.