 $4.99
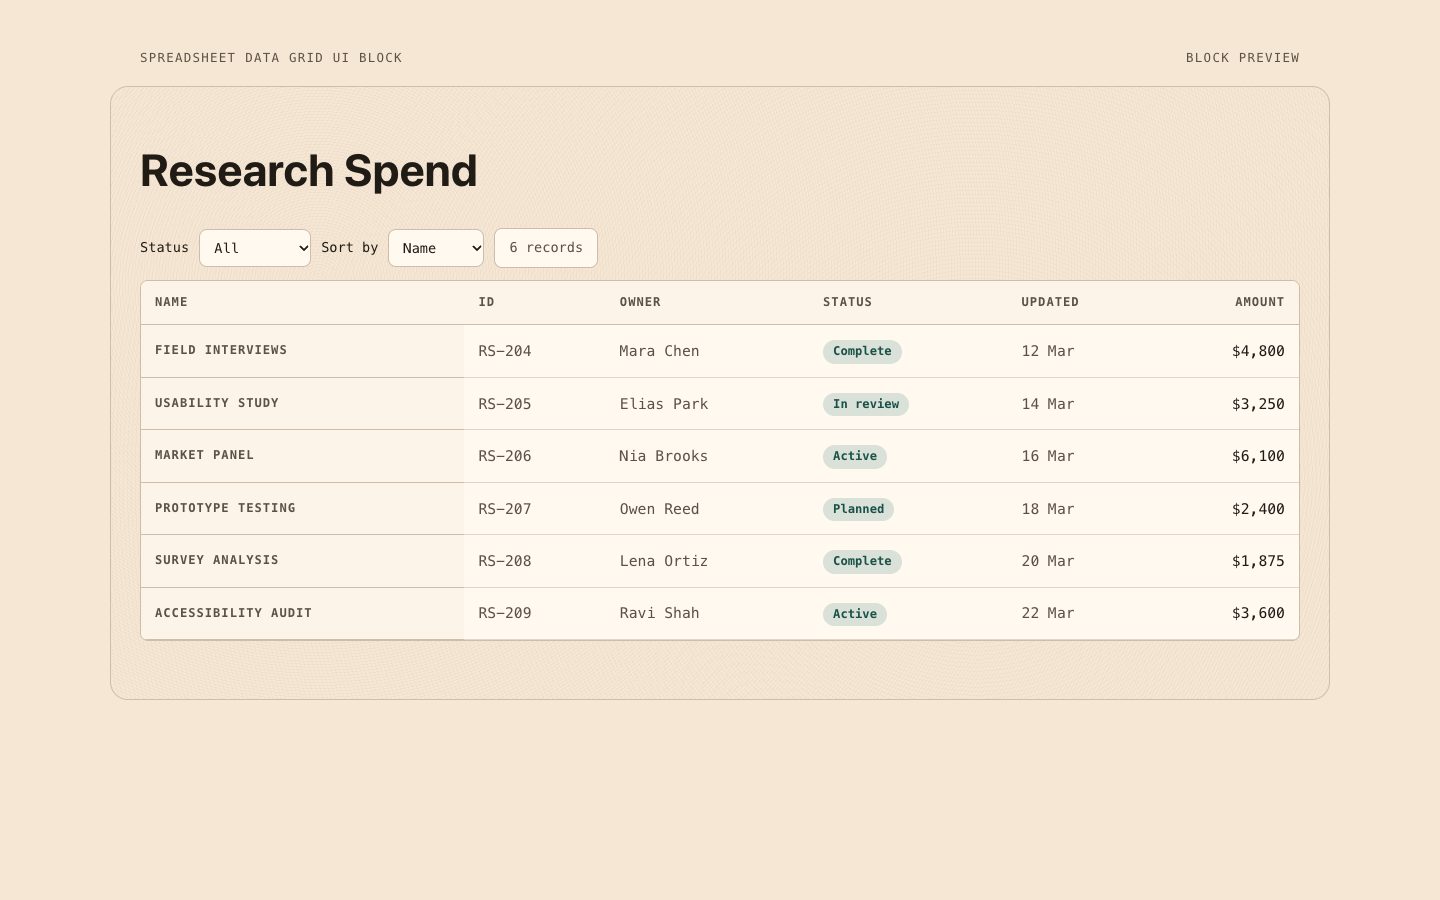
Spreadsheet Data Grid UI Block
A polished, reusable data-grid section for product interfaces and executive or research reporting. Warm paper tones, working accessible controls, and aligned monospaced values make dense records easier to scan.
A figure-led research homepage that presents the question, study design, methods, limitations, and routes to publications and data without overstating the evidence.
No external services. Runs entirely on your agent.
/sl-research-project-homepage-site Create a Transect Block-style homepage for fictional Afterheat Atlas readers: a six-week, 12-site overnight-cooling study. Headline “How does a neighborhood cool after sunset?”. Cover the question, 12 sites/6 weeks/15 min, methods, three figure descriptions, limits, unavailable resources/contact, links, and CTA. End with “Follow the evidence as it develops” and button “Join the resource list”.
Verified
| render-check | pass | 4.0 / 5 | 30s |
Yes. It can foreground the research question and study design, with planned analyses clearly labeled and no invented findings.
Yes. The homepage can link to dedicated Methods, Figures, Publications, and Data pages while retaining consistent navigation and figure conventions.
The site retains the supplied units, uncertainty, scope, and caveats, and places interpretation beside the relevant evidence.
$4.99A polished, reusable data-grid section for product interfaces and executive or research reporting. Warm paper tones, working accessible controls, and aligned monospaced values make dense records easier to scan.
 $4.99
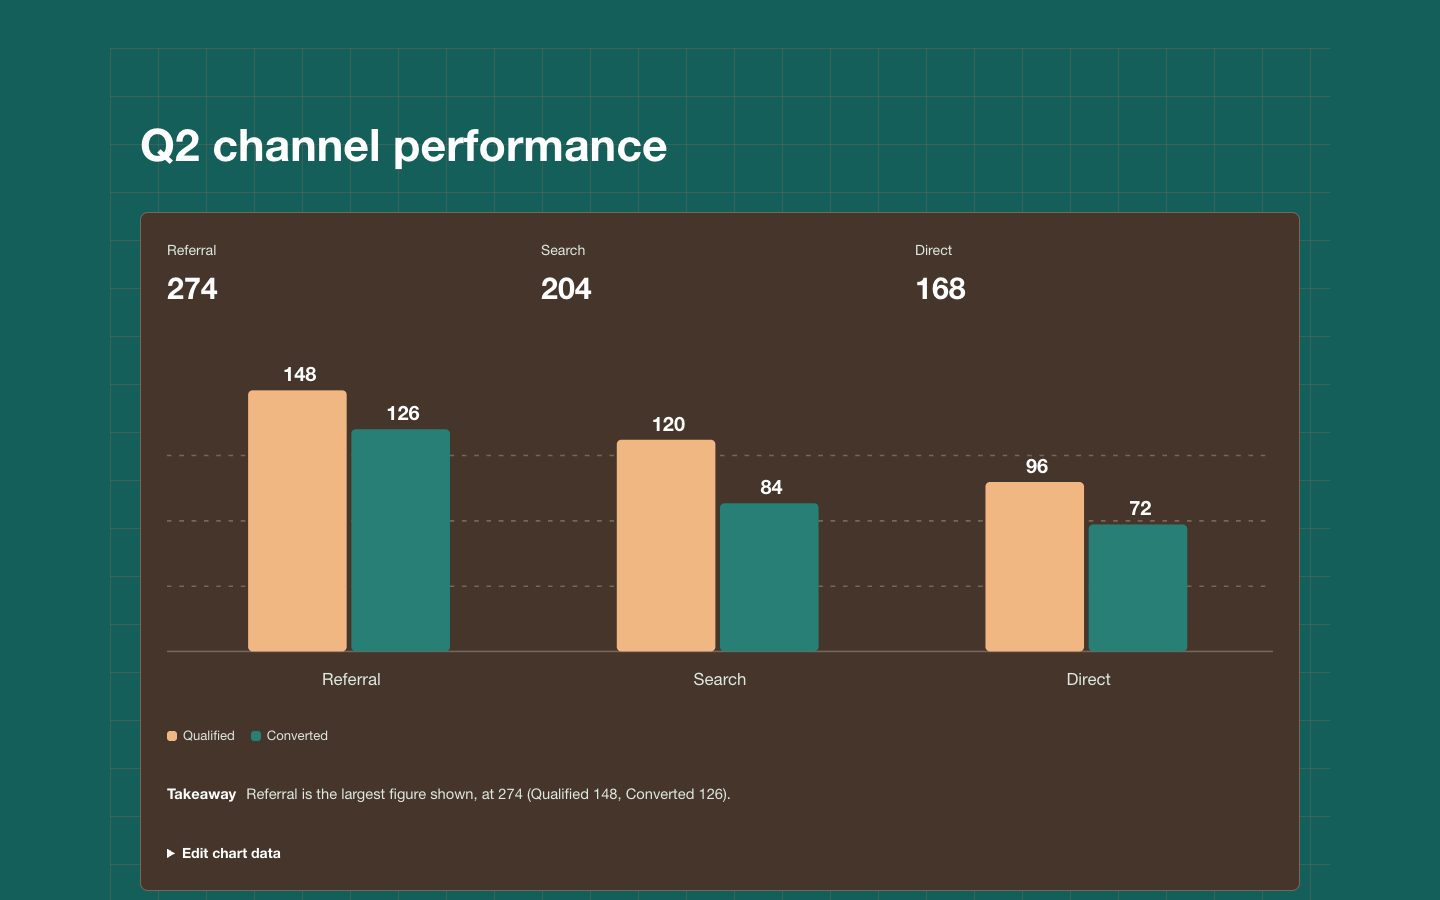
A reusable paired-column chart section for comparing two measures across a handful of categories. Warm dark-clay surfaces, teal and clay bars, and clear labels make it suitable for executive reports and polished product pages.
 $4.99
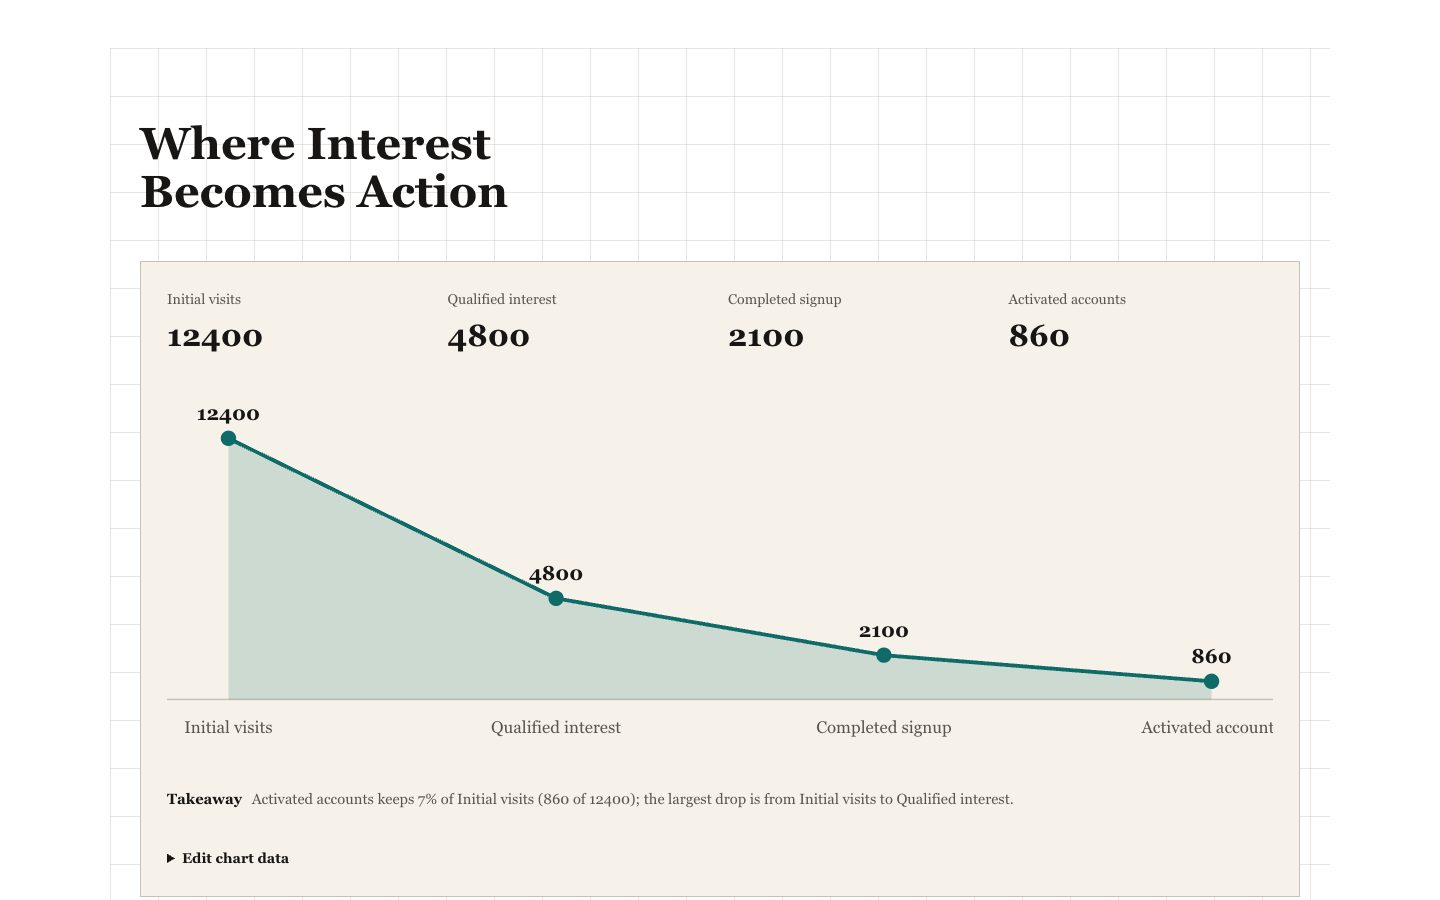
A reusable editorial chart section for showing how an audience narrows across sequential stages. It pairs a filled area silhouette with precise stage values, compact reporting context, and a concise executive takeaway.
 $4.99
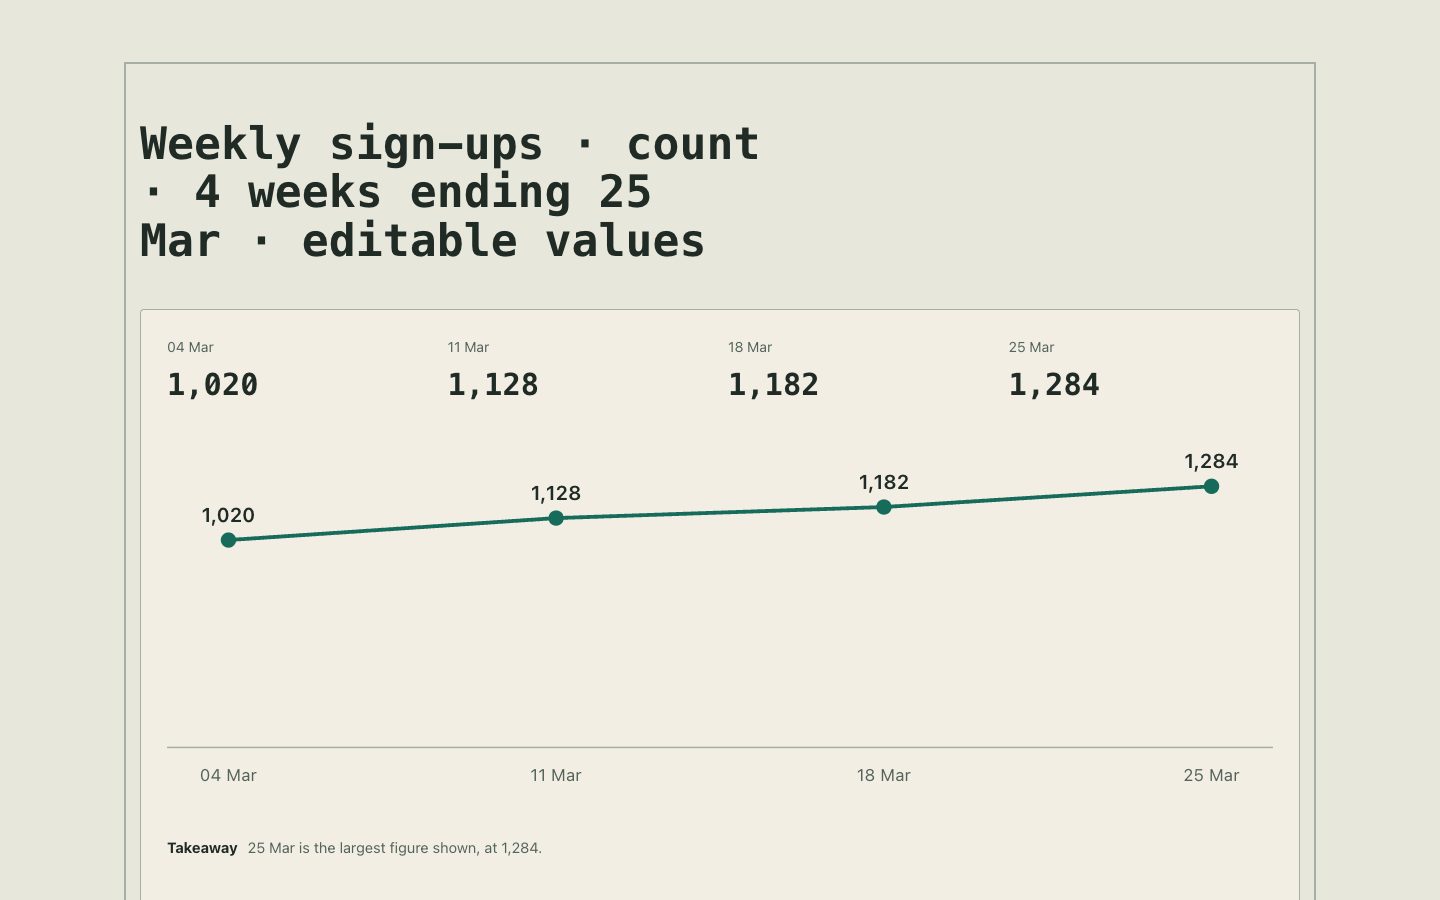
A reusable KPI reporting section that pairs a headline metric with a clearly labeled time-series line chart. Built for product and marketing teams who need a polished, warm-neutral presentation block that remains editable and faithful to the supplied data.
 $4.99
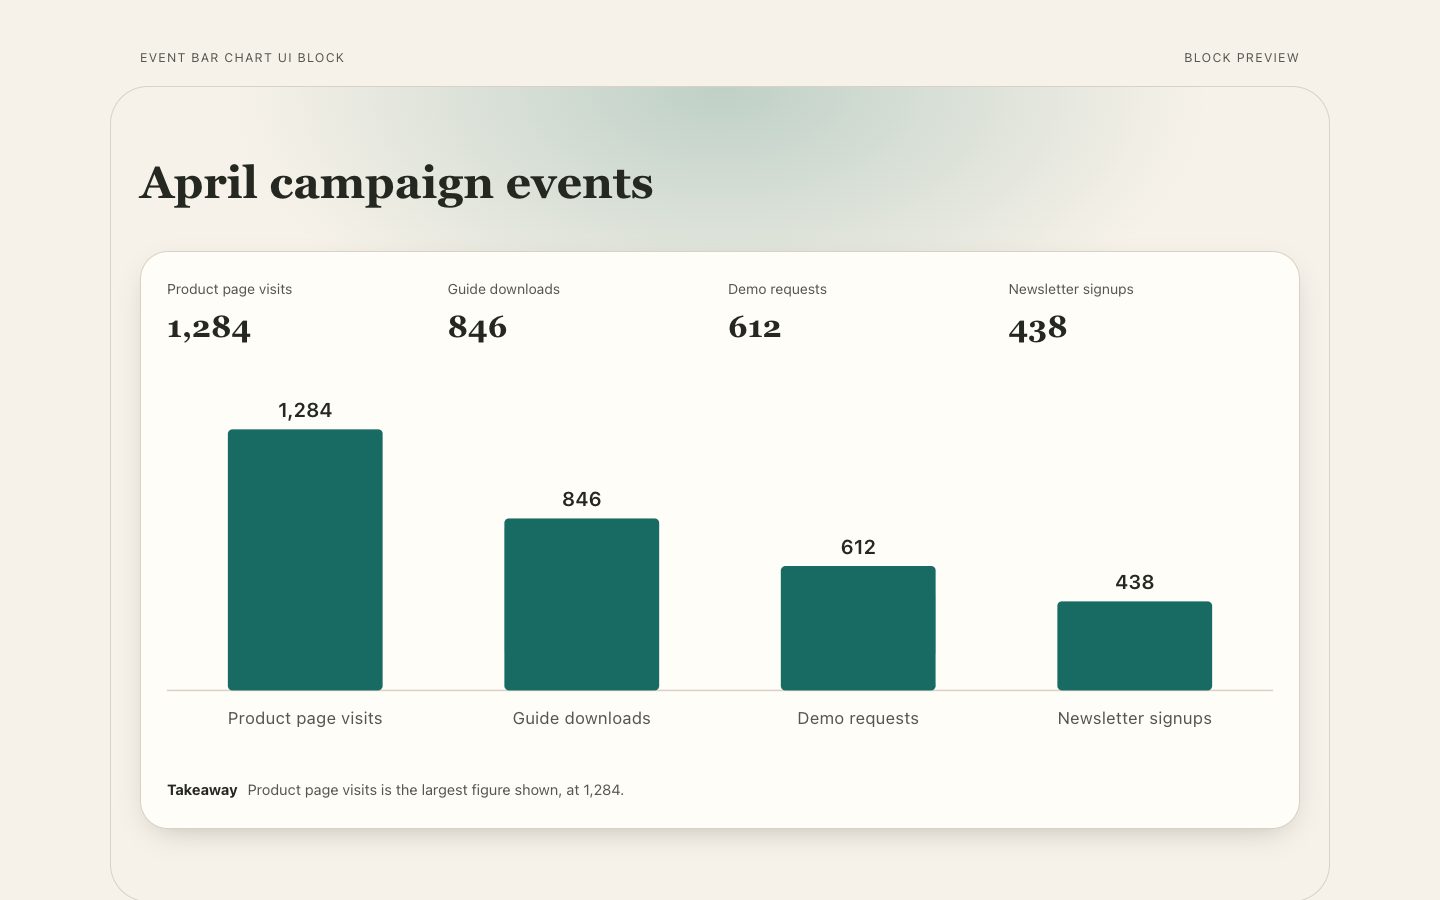
A reusable event comparison chart section with proportional bars, readable direct values, period context, and a concise takeaway for product pages and reports.
 $4.99
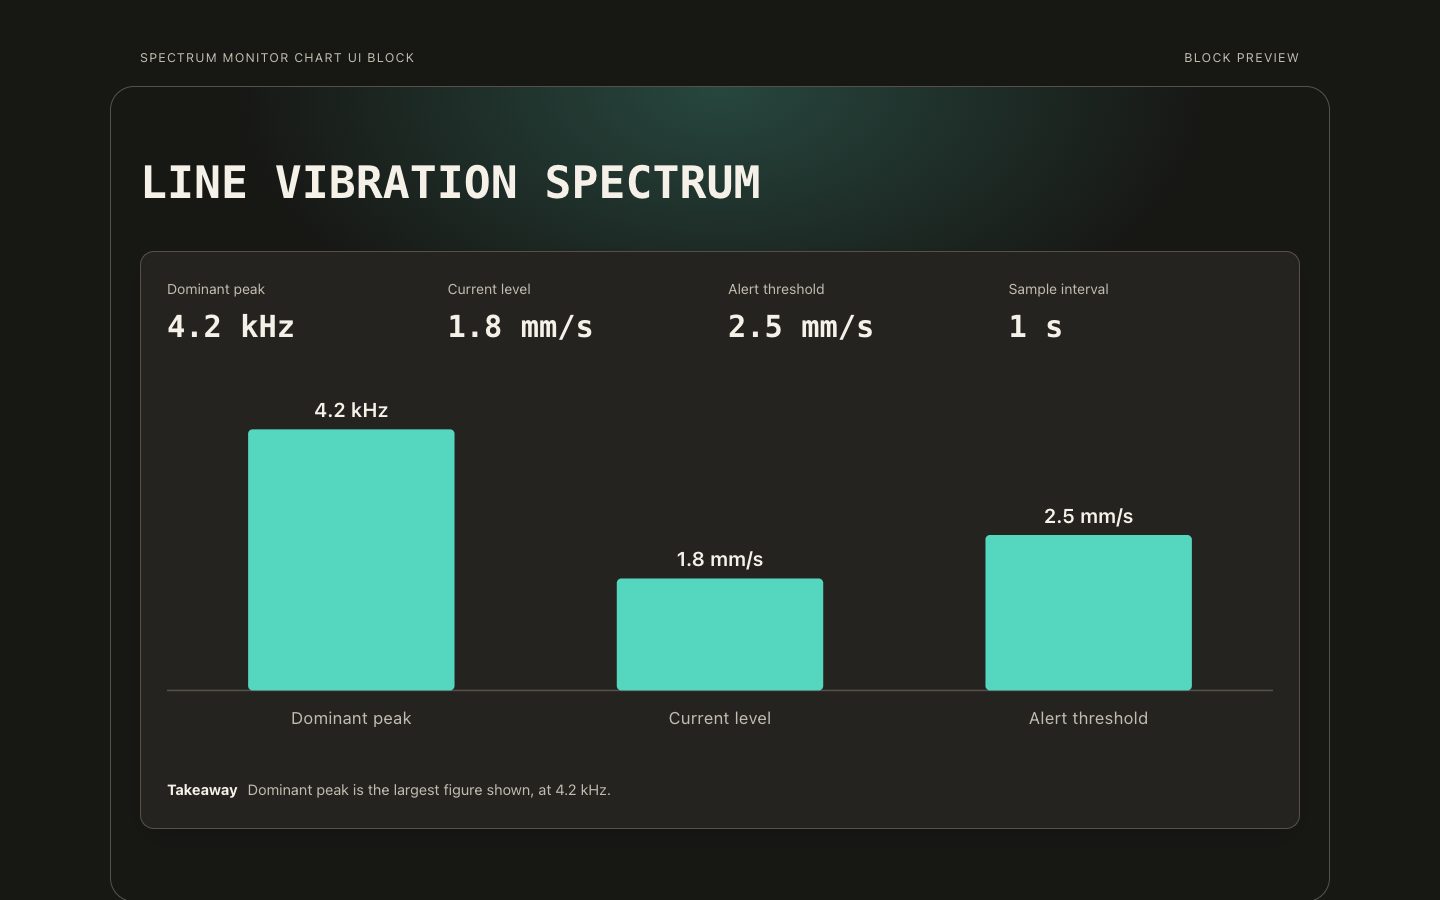
A reusable, editable spectrum monitor section for technical product pages, research summaries, and executive reporting. It pairs a clear signal plot with concise measurement context in a warm-neutral dark interface.
 $4.99
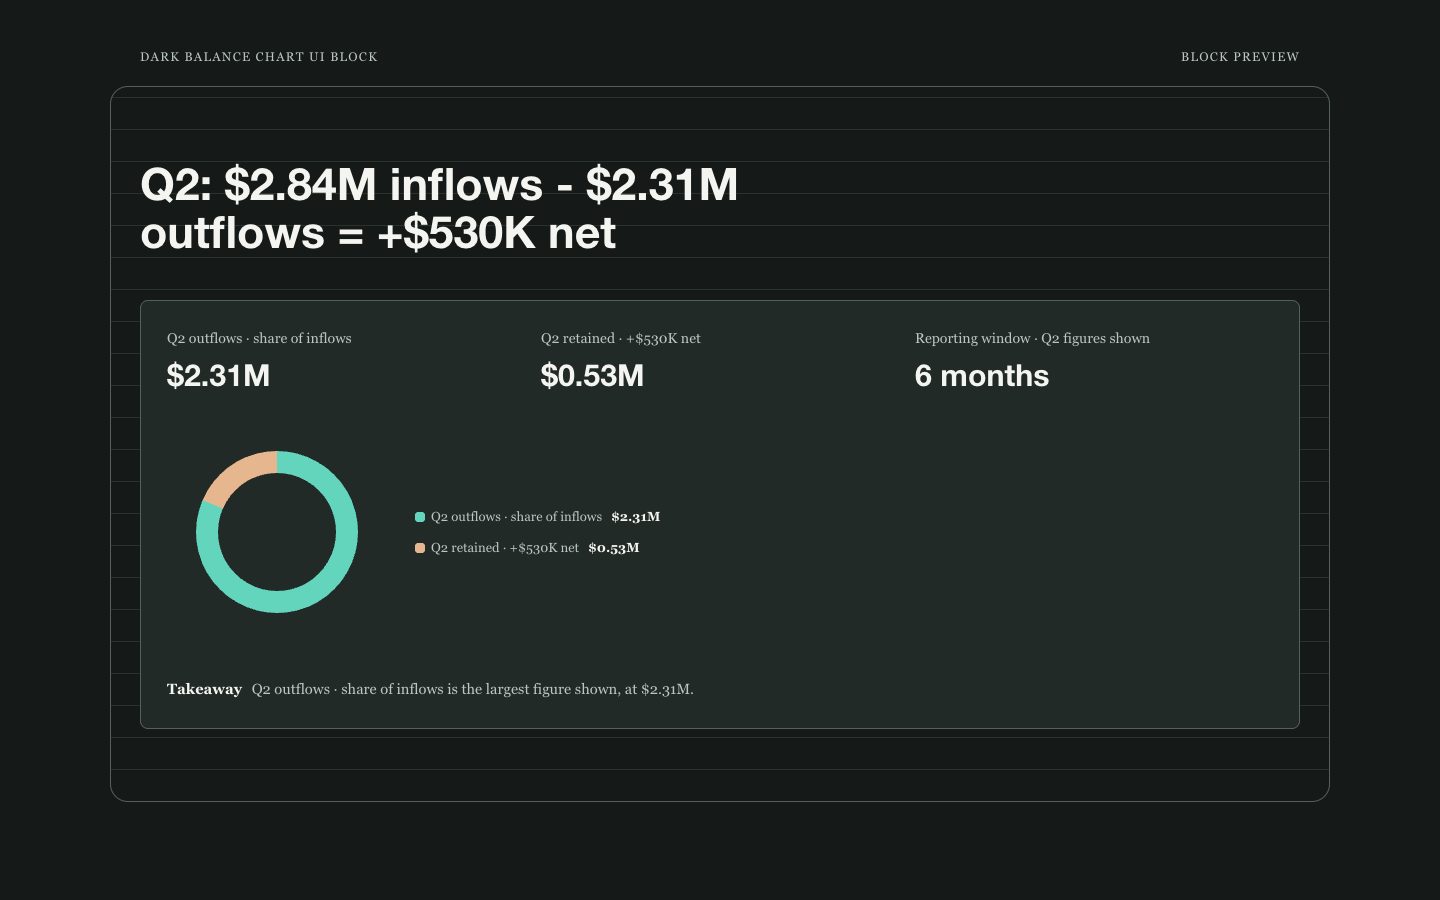
A focused, dark balance-chart section for showing inflows, outflows, and the resulting net over a stated reporting period. It pairs light, legible labels with restrained teal and clay accents and an explicit explanation of what the chart represents.
 $4.99
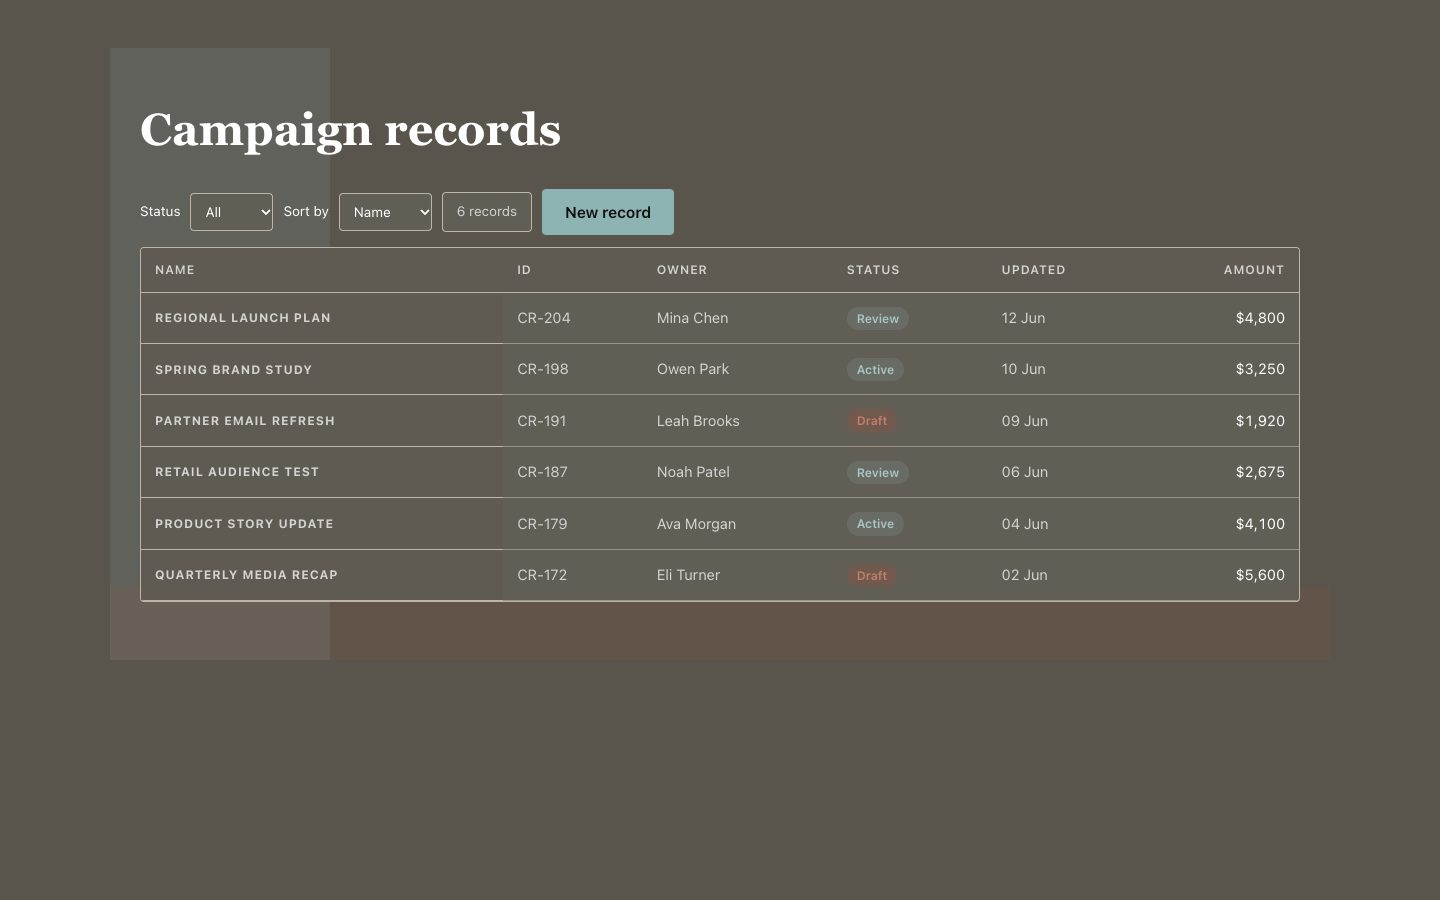
A reusable, polished records grid for reporting and product interfaces, styled with warm-neutral surfaces and crisp teal emphasis. Use it when users need to scan ownership, status, and record details quickly.