WebVerifiedPaired Column Chart UI Block
v1.0.17Use it to build a web page.
npx skillloom-cli install sl-paired-column-chart-ui-block
Updated Oct 5, 2026
- Install guides
- Claude CodeCodex
- Generates with
- Host Agent LLM
- In the package
6 files · 20.0 KB
- SKILL.md
- references/framework-adaptation.md
- references/section-library.md
- references/style-guide.md
- references/template.html
- scripts/validate-html.mjs
Similar skills
WebVerified
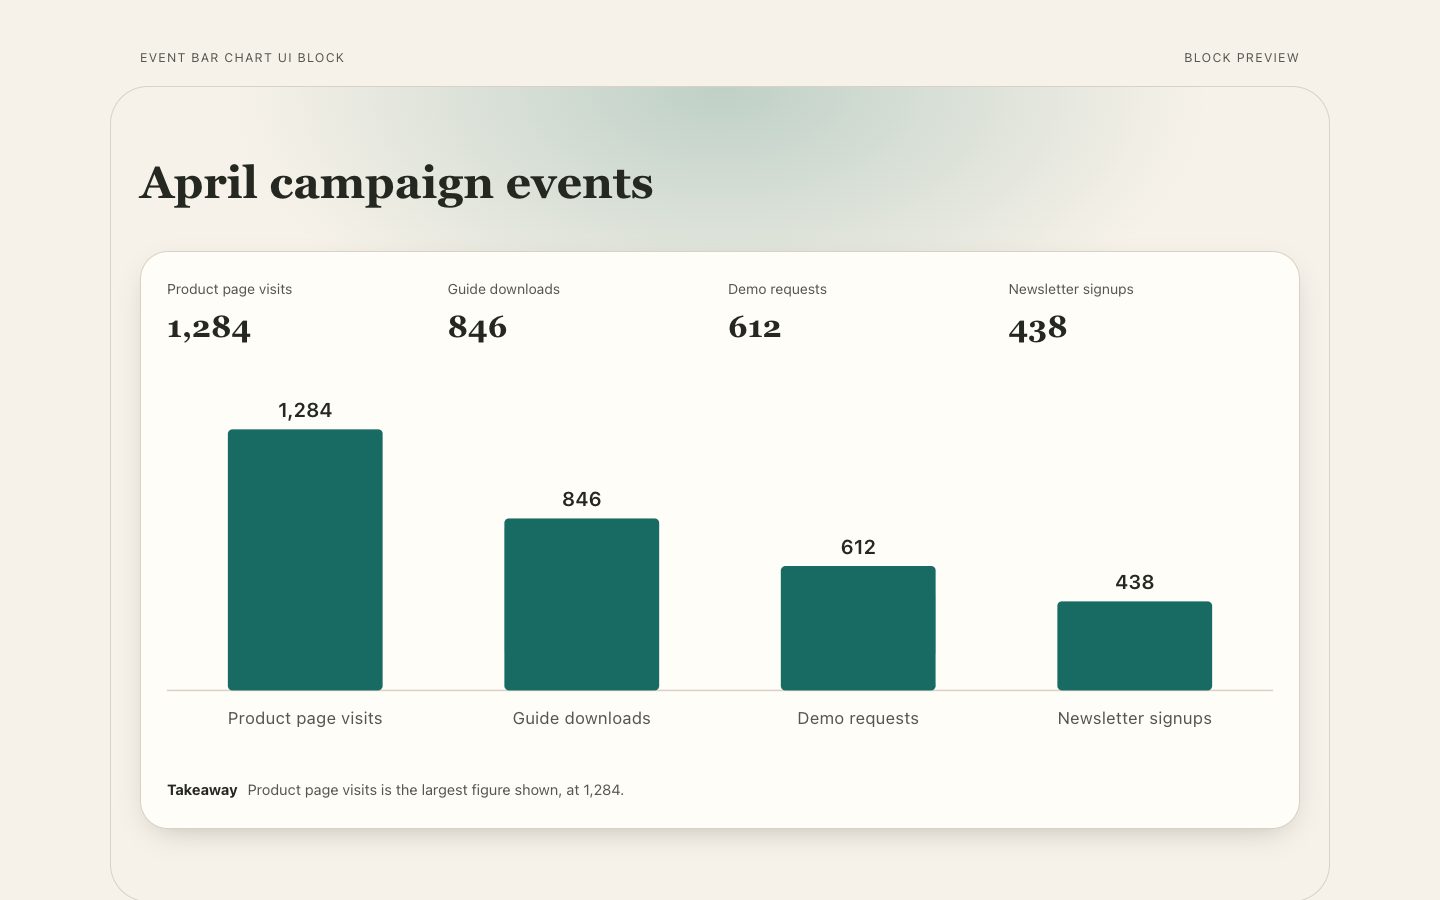
WebVerifiedEvent Bar Chart UI Block
Works with: Claude Code, Cursor, OpenCode, Codex, Gemini CLI
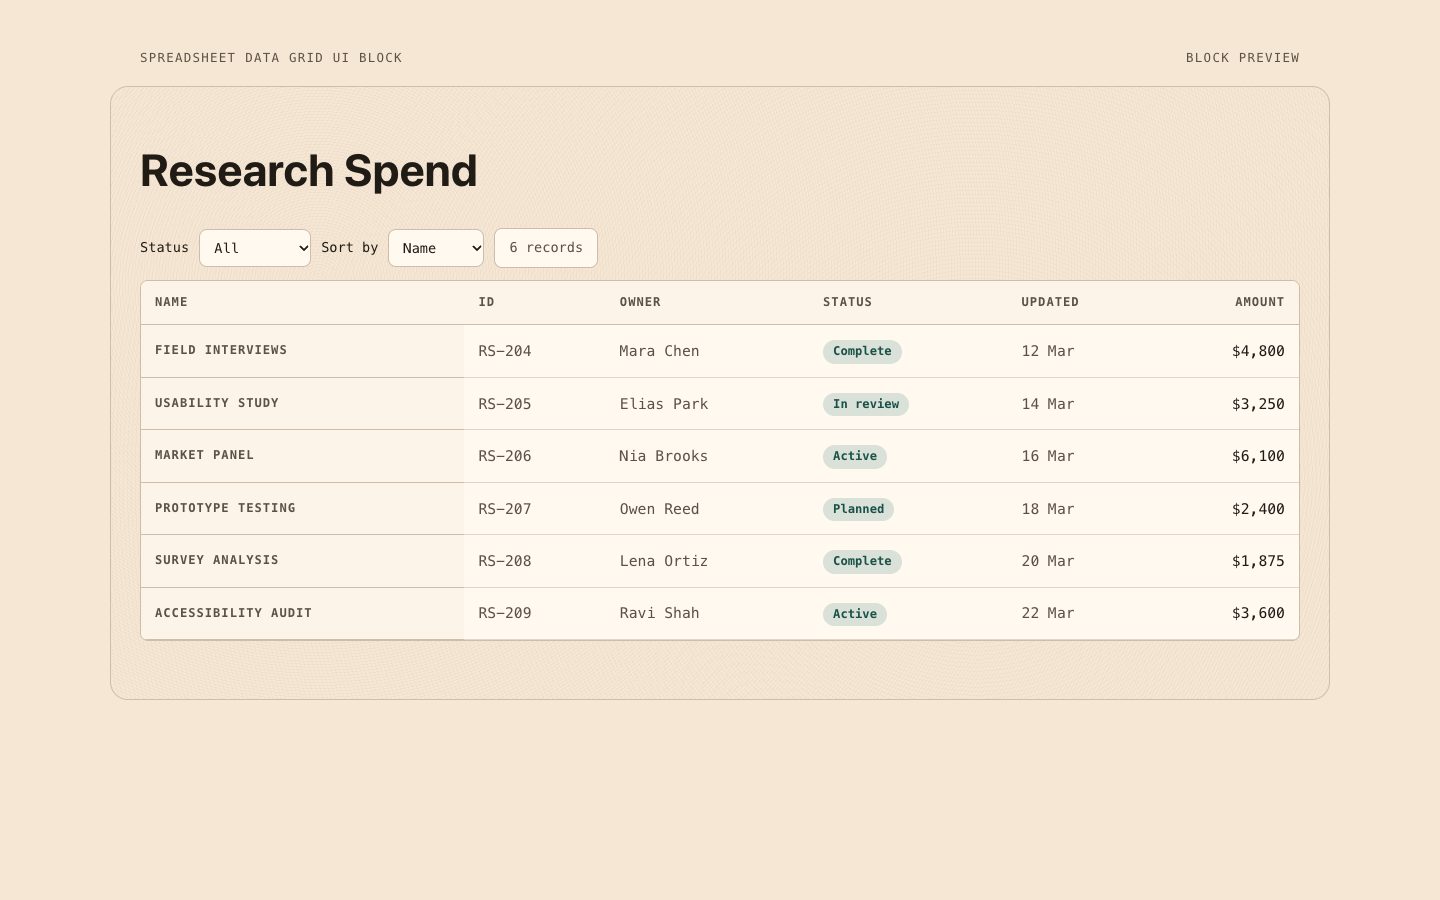
WebVerifiedSpreadsheet Data Grid UI Block
Works with: Claude Code, Cursor, OpenCode, Codex, Gemini CLI
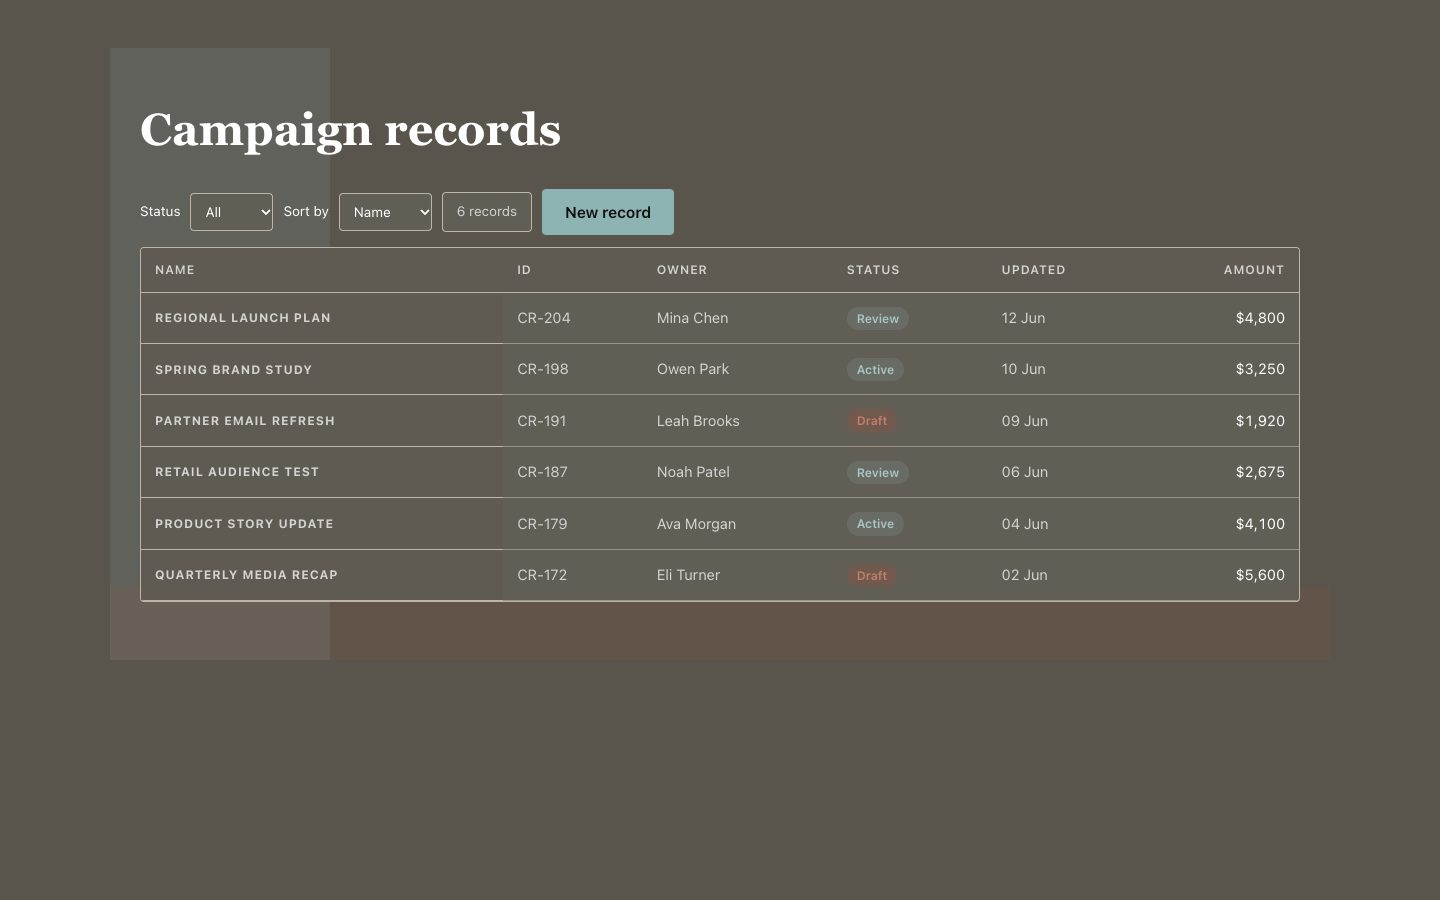
WebVerifiedRecords Data Grid UI Block
Works with: Claude Code, Cursor, OpenCode, Codex, Gemini CLI
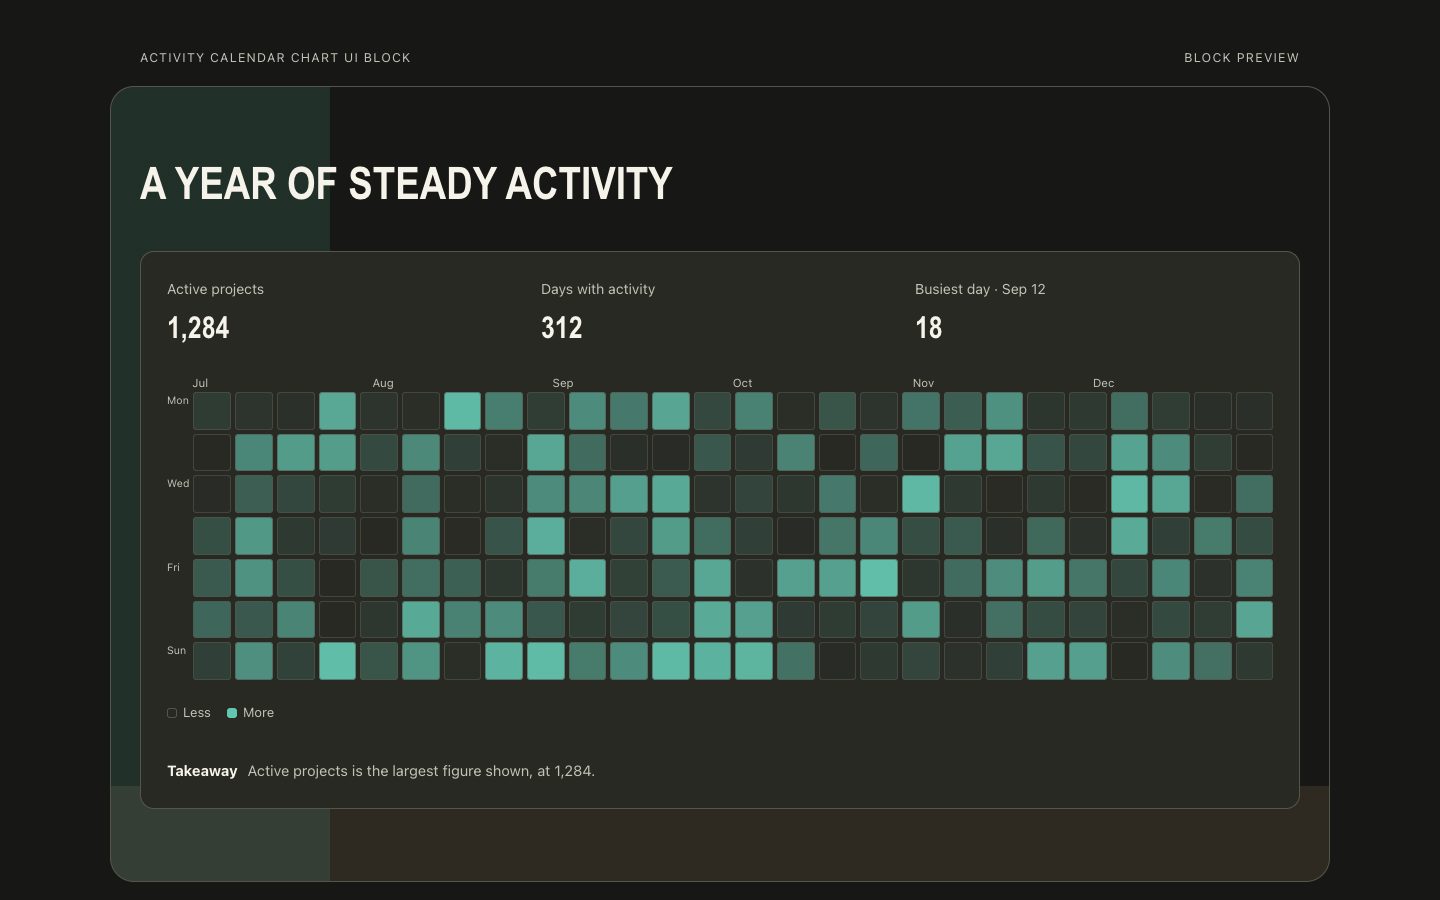
FreeWebVerifiedActivity Calendar Chart UI Block
Works with: Claude Code, Cursor, OpenCode, Codex, Gemini CLI
WebVerifiedParticle Field Hero UI Block
Works with: Claude Code, Cursor, OpenCode, Codex, Gemini CLI
WebVerifiedTiles Hero UI Block
Works with: Claude Code, Cursor, OpenCode, Codex, Gemini CLI
WebVerifiedStrip Hero UI Block
Works with: Claude Code, Cursor, OpenCode, Codex, Gemini CLIWhat you get
- One responsive chart section with two clearly named series
- Shared zero-based scale, category labels, and readable values
- Editable content separated from chart presentation
- Accessible labels and a concise data-led takeaway
Good fit
- Executive summaries comparing current and prior periods
- Product pages showing two measures across feature groups
- Marketing reports comparing campaign results by channel
Not for
- Long time series or dense datasets needing interactive exploration
- Data with incompatible units or scales that cannot be directly compared
Try this prompt
You say
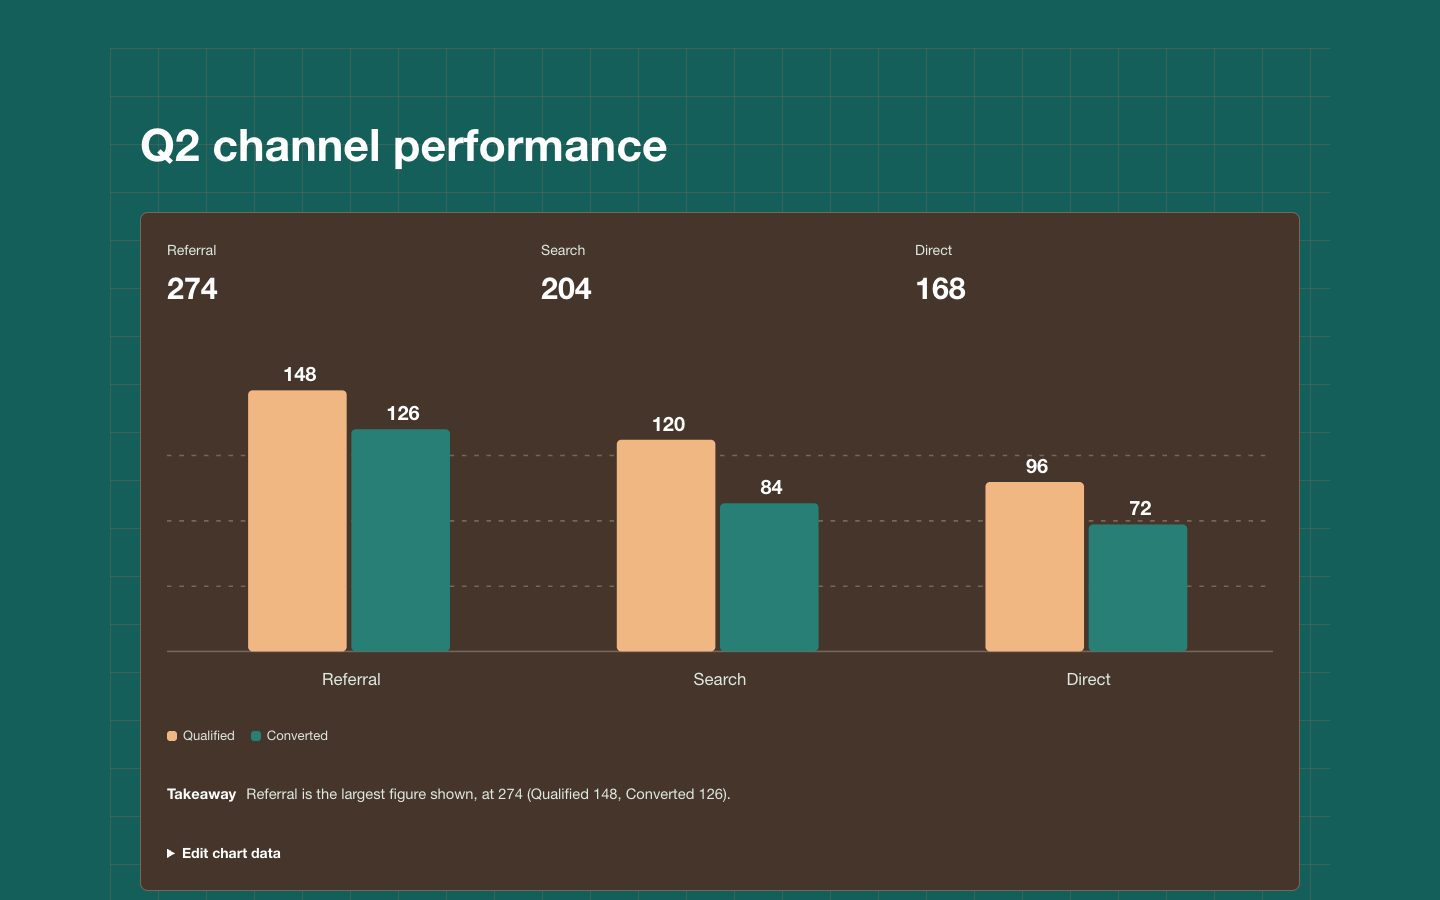
/sl-paired-column-chart-ui-block Create a Q2 channel performance section for a report, showing three channel stats with qualified and converted counts for Referral, Search, and Direct. Use the heading “Q2 channel performance” and show “Qualified 148 · Converted 126”, “Qualified 120 · Converted 84”, and “Qualified 96 · Converted 72”. Keep the Teal Clay Ledger style.
Then try
Add a source note and a compact comparison-period label.
Check the 390px layout: keep every series name and exact value visible without shrinking SVG text.
What you provide
- Two named series with values for matching categories
- Unit and reporting period for the comparison
Requirements
- A modern browser
- Node.js 20+ for the validator
Running cost
No external services. Runs entirely on your agent.
Verification
4.0/ 5
Render score
Verified
| Real render check | Verified | 4.0 / 5 | 18s |
|---|
FAQ
How many categories should the chart contain?
Use three to six categories so paired bars and labels remain scannable. For more categories, choose a denser chart type or provide a separate detail view.
Can the series use different units?
No. A paired-column chart implies direct comparison on one shared scale. Convert to a common unit or use a different visualization.
Will the block work on mobile?
Yes. At narrow widths, each category becomes a row with two horizontal bars and visible, full-size values. The chart must not rely on shrinking SVG text or accessible text alone.